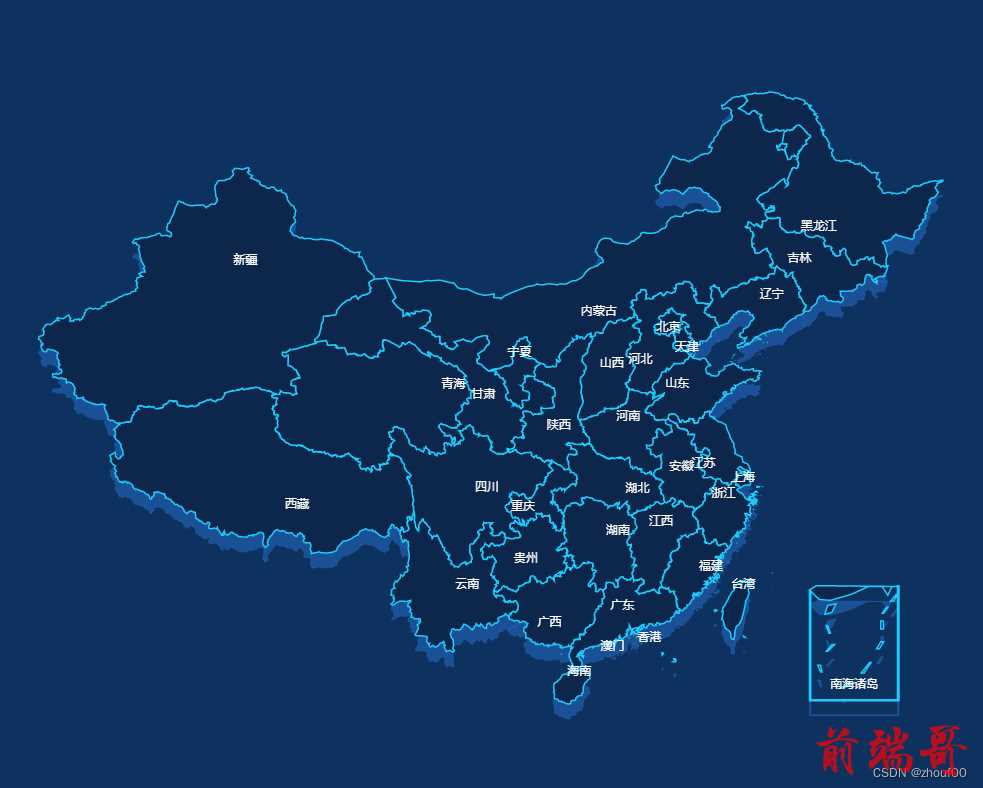
一、echarts安装及地图的准备
1、安装echarts
npm install echarts
2、下载china.js等json文件到项目中的文件夹
map的下载链接:https://pan.baidu.com/s/1rsYANBr3znUUhQLcUmeTIQ
提取码:kscz

二、代码说明
<template>
	<div class="center-body">
		<div class="map" id="map"></div>
		<div class="res-button">
			<button v-if="showButton" @click="reChinaMap()">返回全国</button>
		</div>
	</div>
</template>

<script >
	import * as echarts from "echarts";

	export default {
	name: 'index',
	data() {
		return {
			myChart:null,

			// 省份
			province: {
				"北京": "beijing",
				"天津": "tianjin",
				"上海": "shanghai",
				"重庆": "chongqing",
				"河北": "hebei",
				"河南": "henan",
				"云南": "yunnan",
				"辽宁": "liaoning",
				"黑龙江": "heilongjiang",
				"湖南": "hunan",
				"安徽": "anhui",
				"山东": "shandong",
				"新疆": "xinjiang",
				"江苏": "jiangsu",
				"浙江": "zhejiang",
				"江西": "jiangxi",
				"湖北": "hubei",
				"广西": "guangxi",
				"甘肃": "gansu",
				"山西": "shanxi",
				"内蒙古": "neimenggu",
				"陕西": "shanxi1",
				"吉林": "jilin",
				"福建": "fujian",
				"贵州": "guizhou",
				"广东": "guangdong",
				"青海": "qinghai",
				"西藏": "xizang",
				"四川": "sichuang",
				"宁夏": "ningxia",
				"海南": "hainan",
				"台湾": "taiwan",
				"香港": "xianggang",
				"澳门": "aomen"
			},
		}
	},
	methods:{
		drawMap(name, json) {
			// 前两部是解决切换卡死的关键
			// 判断地图是否渲染
			let myChart = echarts.getInstanceByDom(document.getElementById("map"))
			// 如果渲染则清空地图
			if (myChart != null) {
				myChart.dispose()
			}
			// 初始化地图
			myChart = echarts.init(document.getElementById("map"));
			let size = '95%'
			if (!json) {
				json = require("@/assets/js/map/china.json");
				this.showButton = false
				size = '105%'
			}
			echarts.registerMap(name, json)
			let layoutSize = size
			let option={
				legend: {
					left: '20',
					bottom:'30',
					orient:'vertical',
					textStyle: {
						color: '#c1cadf',
						fontSize: 20
					},
				},
				geo: {
	              map: name,
	              aspectScale: 0.85,
	              layoutCenter: ["50%", "50%"], //地图位置
	              layoutSize: layoutSize,
	              // 新版写法 normal
	              itemStyle: {
                  	shadowColor: "#276fce",
	                shadowOffsetX:0,
	                shadowOffsetY:15,
	                opacity:0.5
	              },
	              // 新版写法 emphasis
	              emphasis: {
	                  itemStyle: {
                      	areaColor: "#276fce",
	                  }
	              },
	              regions:[{
	                  name:'南海诸岛',
	                  itemStyle:{
	                      areaColor: 'rgba(0,10,52,1)',
	                      borderColor: 'rgba(0,10,52,1)',
	                      color:"#009cc9"
	                  },
	                  label:{
	                      show:false,
	                      color:'#ffffff',
	                      fontSize:12,
	                  }
	              }]
	          },
	          series: [
				// 地图
				{
					name: '地图',
					type: "map",
					map: name,
					aspectScale: 0.85,
					layoutCenter: ["50%", "50%"], //地图位置
					layoutSize: layoutSize,
					zoom: 1,
					scaleLimit: {
						min: 1,
						max: 2,
					},
					label:{
						show:true,
						color: "#ffff",
					},
					// 新版写法 normal
					itemStyle: {
						areaColor: "#0c274b",
						borderColor: "#1cccff",
						borderWidth: 1.5,
					},
					// 新版写法 emphasis
					emphasis: {
						itemStyle: {
								areaColor: "#02102b",
								label: {
										color: "#fff"
								}
						}
					},
					selectedMode: false,
				  },
				],
			}
			myChart.setOption(option,true);
			myChart.on('click', e => {
				if (e.seriesName === "地图") {
					//
					this.darwProvniceMap(e)
				}
			}
			window.addEventListener("resize", () => {
				myChart.resize()
			})
			this.myChart = myChart
		},
		// 切换省份
		darwProvniceMap(val) {
			if(this.province[val.name]) {
				let json = require(`@/assets/js/map/province/${this.province[val.name]}.json`)
				this.drawMap(this.province[val.name],json)
				this.showButton = true
			}
		},
		// 返回全国
		reChinaMap() {
			this.drawMap('china')
		},

	}
</script>

<style scoped>
	/*提示框容器*/
	.res-button{
	  position: fixed;
	  top: calc(70px);
	  left: calc(22%+10px);;
	  z-index: 999;
	  border-radius: 6px;
	}
</style>
三、运行效果
本人的经验分享,希望可以帮助到你们,如何不对的地方,可以评论留言,帮我指正一下,如果帮助了你,请给我点个赞吧


