图标类型:
1:bar(柱状) pie(饼图) category(折线图) scatter (散点图) 用 series里面的'type'这个属性设置
// 重点:当窗口或者大小发生改变时执行resize,重新绘制图表 window.onresize = this.chart.resize;
初始化
在 HTML 中定义有宽度和高度的父容器
| <div id="main" style="width: 600px;height:400px;"></div> |
| <script type="text/javascript"> |
| var myChart = echarts.init(document.getElementById('main')); |
| </script> |
如果图表容器不存在宽度和高度,或者,你希望图表宽度和高度不等于容器大小,也可以在初始化的时候指定大小
| <div id="main"></div> |
| <script type="text/javascript"> |
| var myChart = echarts.init(document.getElementById('main'), null, { |
| width: 600, |
| height: 400 |
| }); |
| </script> |
| |
| |
| // 指定图表的配置项和数据 |
| var option = { |
| title: { |
| text: '第一个 ECharts 实例' |
| }, |
| tooltip: {}, |
| legend: { |
| data:['销量'] |
| }, |
| xAxis: { |
| data: ["衬衫","羊毛衫","雪纺衫","裤子","高跟鞋","袜子"] |
| }, |
| yAxis: {}, |
| series: [{ |
| name: '销量', |
| type: 'bar', |
| data: [5, 20, 36, 10, 10, 20] |
| }] |
| }; |
| |
| // 使用刚指定的配置项和数据显示图表。 |
| myChart.setOption(option) |
颜色主题:深色主题
| var chart = echarts.init(dom, 'dark'); |
柱状图
基础柱状图:
| option = { |
| xAxis: { |
| data: ['Mon', 'Tue', 'Wed', 'Thu', 'Fri', 'Sat', 'Sun'] |
| }, |
| yAxis: {}, |
| series: [ |
| { |
| type: 'bar', |
| data: [23, 24, 18, 25, 27, 28, 25] |
| } |
| ] |
| }; |
多列柱状图
| option = { |
| xAxis: { |
| data: ['Mon', 'Tue', 'Wed', 'Thu', 'Fri', 'Sat', 'Sun'] |
| }, |
| yAxis: {}, |
| series: [ |
| { |
| type: 'bar', |
| data: [23, 24, 18, 25, 27, 28, 25] |
| }, |
| { |
| type: 'bar', |
| data: [26, 24, 18, 22, 23, 20, 27] |
| } |
| ] |
| }; |
柱条样式:
| option = { |
| xAxis: { |
| data: ['A', 'B', 'C', 'D', 'E'] |
| }, |
| yAxis: {}, |
| series: [ |
| { |
| type: 'bar', |
| data: [ |
| 10, |
| 22, |
| 28, |
| { |
| value: 43, |
| // 设置单个柱子的样式 |
| itemStyle: { |
| color: '#91cc75', |
| shadowColor: '#91cc75', |
| borderType: 'dashed', |
| opacity: 0.5 |
| } |
| }, |
| 49 |
| ], |
| itemStyle: { |
| barBorderRadius: 5, |
| borderWidth: 1, |
| borderType: 'solid', |
| borderColor: '#73c0de', |
| shadowColor: '#5470c6', |
| shadowBlur: 3 |
| } |
| } |
| ] |
| }; |
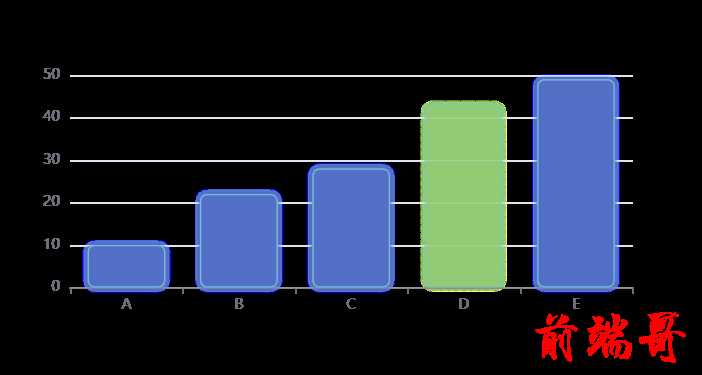
柱条宽度和高度
| option = { |
| xAxis: { |
| data: ['A', 'B', 'C', 'D', 'E'] |
| }, |
| yAxis: {}, |
| series: [ |
| { |
| type: 'bar', |
| data: [10, 22, 28, 43, 49], |
| barWidth: '20%' |
| } |
| ] |
| }; |
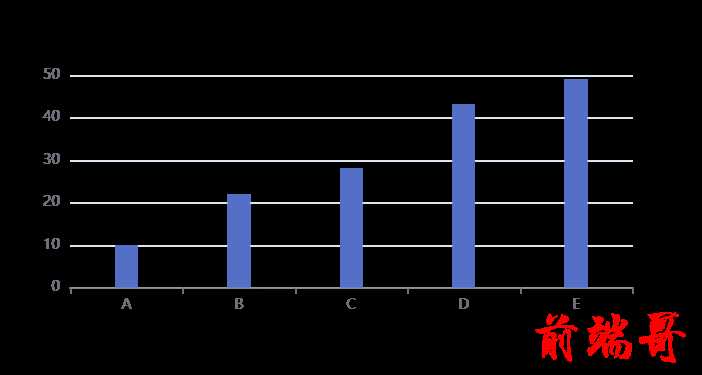
给柱条添加背景颜色
| showBackground: true, |
| backgroundStyle: { |
| color: 'rgba(220, 220, 220, 0.8)' |
| } |
堆叠柱状图
stack
| option = { |
| xAxis: { |
| data: ['A', 'B', 'C', 'D', 'E'] |
| }, |
| yAxis: {}, |
| series: [ |
| { |
| data: [10, 22, 28, 43, 49], |
| type: 'bar', |
| stack: 'x' |
| }, |
| { |
| data: [5, 4, 3, 5, 10], |
| type: 'bar', |
| stack: 'x' |
| } |
| ] |
| }; |
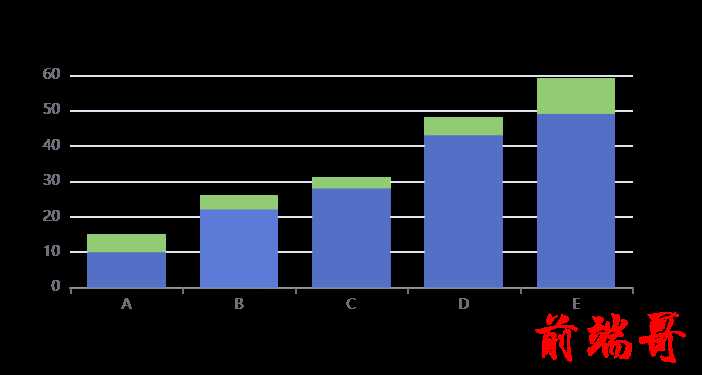
折线图
基础折线图
| option = { |
| xAxis: { |
| type: 'category', |
| data: ['A', 'B', 'C'] |
| }, |
| yAxis: { |
| type: 'value' |
| }, |
| series: [ |
| { |
| data: [120, 200, 150], |
| type: 'line' |
| } |
| ] |
| }; |
在数据点处显示样式:
这数据点的标签通过 series.label 属性指定。如果将 label 下的 show 指定为true,则表示该数值默认时就显示;如果为 false,而 series.emphasis.label.show 为 true,则表示只有在鼠标移动到该数据时,才显示数值。
| option = { |
| xAxis: { |
| data: ['A', 'B', 'C', 'D', 'E'] |
| }, |
| yAxis: {}, |
| series: [ |
| { |
| data: [10, 22, 28, 23, 19], |
| type: 'line', |
| label: { |
| show: true, |
| position: 'bottom', |
| textStyle: { |
| fontSize: 20 |
| } |
| } |
| } |
| ] |
| }; |
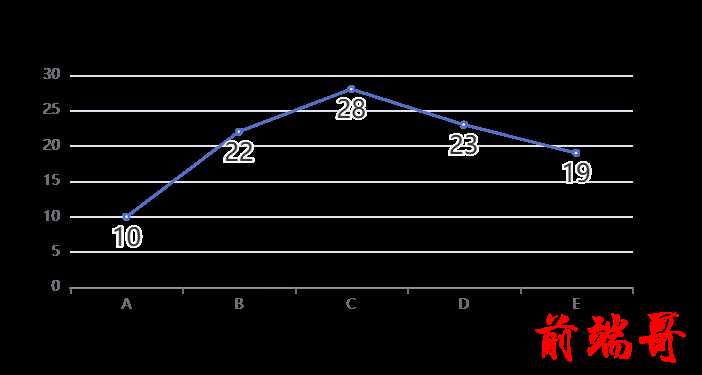
堆叠折线图和堆叠柱状图类似
饼图
| option = { |
| series: [ |
| { |
| type: 'pie', |
| data: [ |
| { |
| value: 335, |
| name: '直接访问' |
| }, |
| { |
| value: 234, |
| name: '联盟广告' |
| }, |
| { |
| value: 1548, |
| name: '搜索引擎' |
| } |
| ] |
| } |
| ] |
| }; |
如果数据和为 0,不显示饼图
在默认情况下,如果数据值和为 0,会显示平均分割的扇形。比如,如果有 4 个数据项,并且每个数据项都是 0,则每个扇形都是 90°。如果我们希望在这种情况下不显示任何扇形,可以将 series.stillShowZeroSum 设为 false
| option = { |
| series: [ |
| { |
| type: 'pie', |
| stillShowZeroSum: false, |
| data: [ |
| { |
| value: 0, |
| name: '直接访问' |
| }, |
| { |
| value: 0, |
| name: '联盟广告' |
| }, |
| { |
| value: 0, |
| name: '搜索引擎' |
| } |
| ] |
| } |
| ] |
| }; |
如果希望扇形对应的标签也不显示,可以将 series.label.show 设为 false。
| option = { |
| series: [ |
| { |
| type: 'pie', |
| stillShowZeroSum: false, |
| label: { |
| show: false |
| }, |
| data: [ |
| { |
| value: 0, |
| name: '直接访问' |
| }, |
| { |
| value: 0, |
| name: '联盟广告' |
| }, |
| { |
| value: 0, |
| name: '搜索引擎' |
| } |
| ] |
| } |
| ] |
| }; |
圆环图
| option = { |
| title: { |
| text: '圆环图的例子', |
| left: 'center', |
| top: 'center' |
| }, |
| series: [ |
| { |
| type: 'pie', |
| data: [ |
| { |
| value: 335, |
| name: 'A' |
| }, |
| { |
| value: 234, |
| name: 'B' |
| }, |
| { |
| value: 1548, |
| name: 'C' |
| } |
| ], |
| radius: ['70%', '40%'] |
| } |
| ] |
| }; |
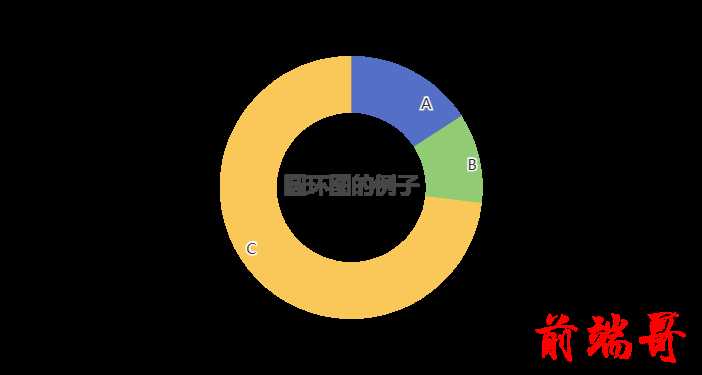
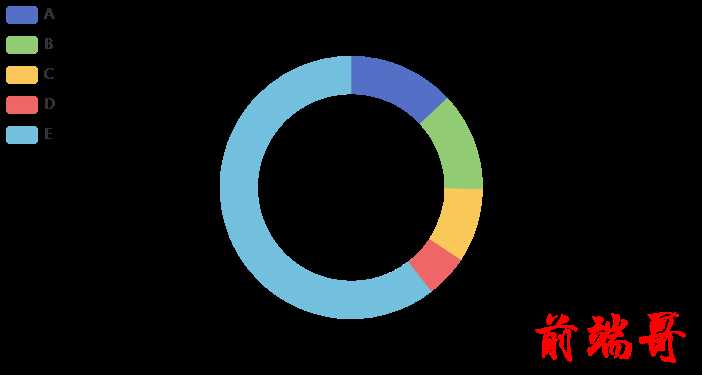
在圆环图中间显示高亮扇形对应的文字
| option = { |
| legend: { |
| orient: 'vertical', |
| x: 'left', |
| data: ['A', 'B', 'C', 'D', 'E'] |
| }, |
| series: [ |
| { |
| type: 'pie', |
| radius: ['50%', '70%'], |
| avoidLabelOverlap: false, |
| label: { |
| show: false, |
| position: 'center' |
| }, |
| labelLine: { |
| show: false |
| }, |
| emphasis: { |
| label: { |
| show: true, |
| fontSize: '30', |
| fontWeight: 'bold' |
| } |
| }, |
| data: [ |
| { value: 335, name: 'A' }, |
| { value: 310, name: 'B' }, |
| { value: 234, name: 'C' }, |
| { value: 135, name: 'D' }, |
| { value: 1548, name: 'E' } |
| ] |
| } |
| ] |
| }; |
南丁格尔图
ECharts 可以通过将饼图的 series.roseType 值设为 'area' 实现南丁格尔图,其他配置项和饼图是相同的。
| option = { |
| series: [ |
| { |
| type: 'pie', |
| data: [ |
| { |
| value: 100, |
| name: 'A' |
| }, |
| { |
| value: 200, |
| name: 'B' |
| }, |
| { |
| value: 300, |
| name: 'C' |
| }, |
| { |
| value: 400, |
| name: 'D' |
| }, |
| { |
| value: 500, |
| name: 'E' |
| } |
| ], |
| roseType: 'area' |
| } |
| ] |
| }; |
散点图:
| option = { |
| xAxis: { |
| data: ['Sun', 'Mon', 'Tue', 'Wed', 'Thu', 'Fri', 'Sat'] |
| }, |
| yAxis: {}, |
| series: [ |
| { |
| type: 'scatter', |
| data: [220, 182, 191, 234, 290, 330, 310] |
| } |
| ] |
| }; |
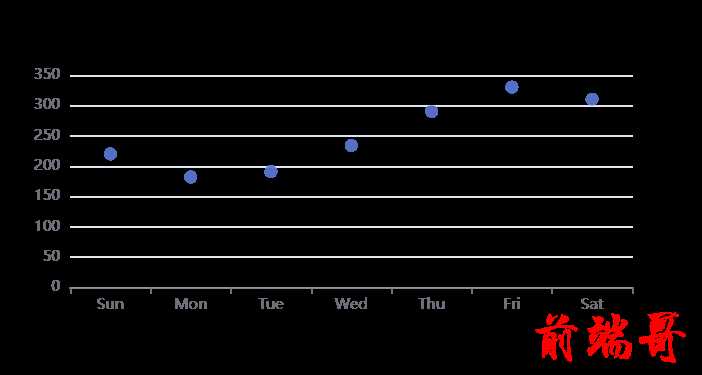
图形的大小:
图形大小可以使用 series.symbolSize 控制。它既可以是一个表示图形大小的像素值,也可以是一个包含两个 number 元素的数组,分别表示图形的宽和高。
散点图点的大小设置为与其数据值成正比。
| option = { |
| xAxis: { |
| data: ['Sun', 'Mon', 'Tue', 'Wed', 'Thu', 'Fri', 'Sat'] |
| }, |
| yAxis: {}, |
| series: [ |
| { |
| type: 'scatter', |
| data: [220, 182, 191, 234, 290, 330, 310], |
| symbolSize: function(value) { |
| return value / 10; |
| } |
| } |
| ] |
| }; |

Ajax异步数据请求:
| var myChart = echarts.init(document.getElementById('main')); |
| |
| myChart.setOption({ |
| title: { |
| text: '异步数据加载示例' |
| }, |
| tooltip: {}, |
| legend: { |
| data: ['销量'] |
| }, |
| xAxis: { |
| data: [] |
| }, |
| yAxis: {}, |
| series: [ |
| { |
| name: '销量', |
| type: 'bar', |
| data: [] |
| } |
| ] |
| }); |
| |
| |
| $.get('data.json').done(function(data) { |
| |
| myChart.setOption({ |
| xAxis: { |
| data: data.categories |
| }, |
| series: [ |
| { |
| |
| name: '销量', |
| data: data.data |
| } |
| ] |
| }); |
| }); |


