前言:
ECharts,一个使用 JavaScript 实现的开源可视化库,可以流畅的运行在 PC 和移动设备上,兼容当前绝大部分浏览器(IE9/10/11,Chrome,Firefox,Safari等),底层依赖矢量图形库 ZRender,提供直观,交互丰富,可高度个性化定制的数据可视化图表。
1、安装
(1)安装echarts包
| npm install echarts --save |
| cnpm install echarts --save |
(2)安装vue echarts工具包
| npm install echarts vue-echarts |
| cnpm install echarts vue-echarts |
2、挂载
(1)按需引入的挂载方式
本文选择vue3,以下是挂载/注册方式:
| import { createApp } from 'vue' |
| import ECharts from 'vue-echarts' |
| import { use } from "echarts/core"; |
| |
| |
| import { |
| CanvasRenderer |
| } from 'echarts/renderers' |
| import { |
| BarChart |
| } from 'echarts/charts' |
| import { |
| GridComponent, |
| TooltipComponent |
| } from 'echarts/components' |
| |
| use([ |
| CanvasRenderer, |
| BarChart, |
| GridComponent, |
| TooltipComponent |
| ]); |
| |
| const app = createApp(...) |
| |
| |
| app.component('v-chart', ECharts) |
(2)全局引入的挂载方式
在main.js文件中
| import { createApp } from 'vue' |
| import App from './App.vue' |
| |
| import ECharts from 'vue-echarts' |
| import "echarts"; |
| |
| |
| |
| const app=createApp(App) |
| app.component('ECharts',ECharts) |
| app.mount('#app') |
3、示例
3.1 情形一:一个页面中只使用1~2个ECharts图表
| <template> |
| <div> |
| <e-charts class="chart" :option="option" /> |
| </div> |
| |
| </template> |
| |
| <script setup> |
| import { ref,computed } from 'vue' |
| |
| const data = ref([ |
| {value:67,name:'A'}, |
| {value:40,name:'B'}, |
| {value:120,name:'C'}, |
| {value:58,name:'D'}, |
| {value:85,name:'E'}, |
| ]) |
| |
| setInterval(()=>{ |
| data.value = data.value.map(item=>({ |
| ...item, |
| value:Math.random()*100, |
| })) |
| },1000) |
| |
| const option = computed(()=>{ |
| return { |
| xAxis: { |
| type: 'category', |
| data: data.value.map(el=>el.name) |
| }, |
| yAxis: { |
| type: 'value' |
| }, |
| series: [ |
| { |
| data: data.value.map(el=>el.value), |
| type: 'line' |
| } |
| ] |
| |
| } |
| }) |
| </script> |
| |
| <style scoped> |
| .chart { |
| height: 400px; |
| } |
| </style> |
| |
3.1 情形二:一个页面中使用了多个ECharts图表
注意:如果要在一个页面中使用多个ECharts图表,就会出现很多很多option和类名chart,容易混乱,所以最好把图表们封装成组件使用。
(1)组件
| <template> |
| <div> |
| <e-charts id="main" class="chart" :option="option" /> |
| </div> |
| </template> |
| |
| <script setup> |
| import { onMounted } from "vue"; |
| import * as echarts from 'echarts'; |
| |
| onMounted(() => { |
| var chartDom = document.getElementById('main'); |
| var myChart = echarts.init(chartDom); |
| var option; |
| |
| option = { |
| legend: { |
| top: 'bottom' |
| }, |
| toolbox: { |
| show: true, |
| feature: { |
| mark: { show: true }, |
| dataView: { show: true, readOnly: false }, |
| restore: { show: true }, |
| saveAsImage: { show: true } |
| } |
| }, |
| series: [ |
| { |
| name: 'Nightingale Chart', |
| type: 'pie', |
| radius: [50, 250], |
| center: ['50%', '50%'], |
| roseType: 'area', |
| itemStyle: { |
| borderRadius: 8 |
| }, |
| data: [ |
| { value: 40, name: 'rose 1' }, |
| { value: 38, name: 'rose 2' }, |
| { value: 32, name: 'rose 3' }, |
| { value: 30, name: 'rose 4' }, |
| { value: 28, name: 'rose 5' }, |
| { value: 26, name: 'rose 6' }, |
| { value: 22, name: 'rose 7' }, |
| { value: 18, name: 'rose 8' } |
| ] |
| } |
| ] |
| }; |
| option && myChart.setOption(option); |
| }); |
| </script> |
| |
| <style scoped> |
| // 宽高根据自身情况调整 |
| .chart { |
| width: 500px; |
| height: 500px; |
| } |
| </style> |
(2)vue文件中
| <template> |
| <div class="echarts"> |
| <Nightingale /> |
| </div> |
| </template> |
| |
| <script setup> |
| |
| import Nightingale from "@/components/Echarts/NightingaleChart.vue"; |
| </script> |
| |
| <style scoped> |
| .echarts { |
| height: 500px; |
| width: 500px; |
| } |
| </style> |
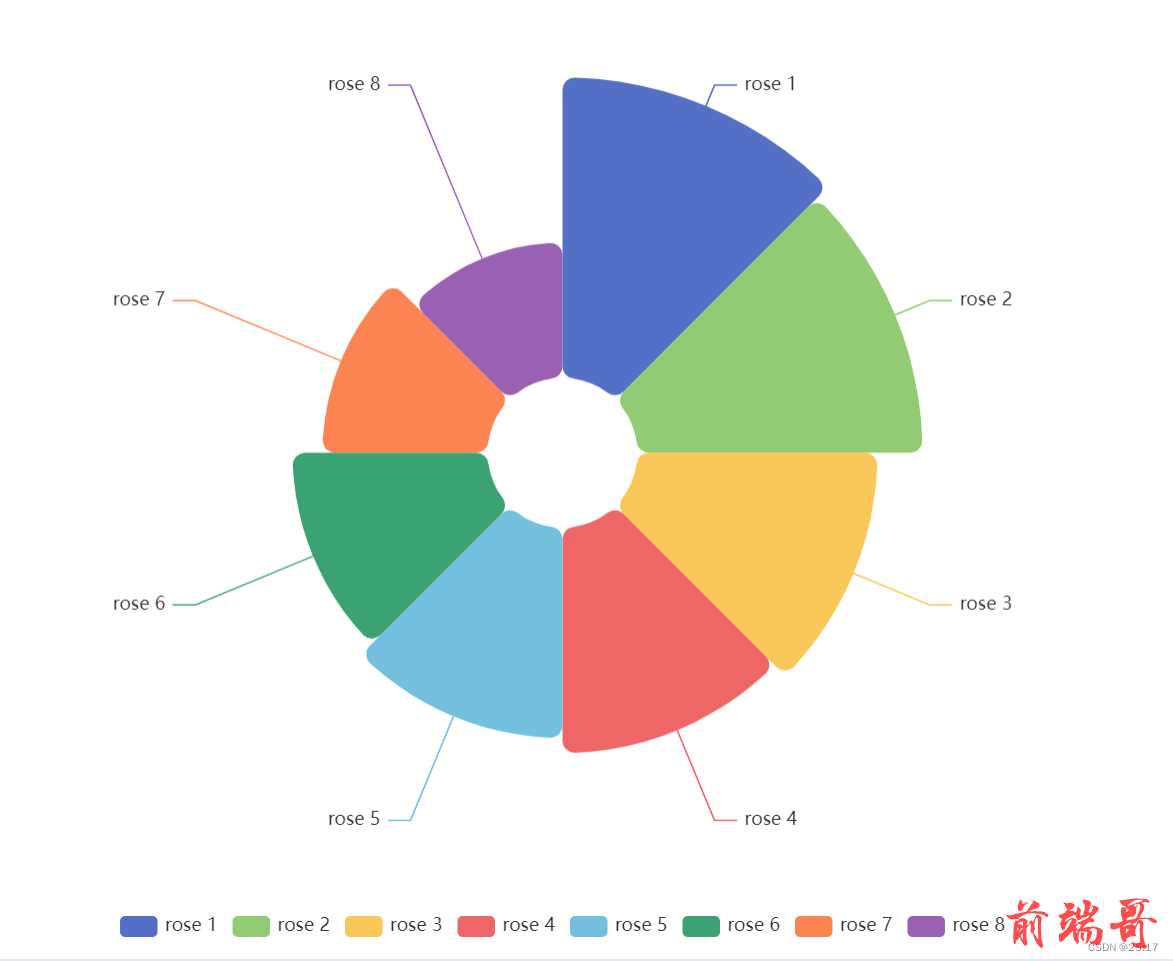
(3)效果
可以根据自身情况对options内的数据进行调整