| <div id="echartsSigns" style="height: 700px;width:900px;margin: auto;"></div> |
| |
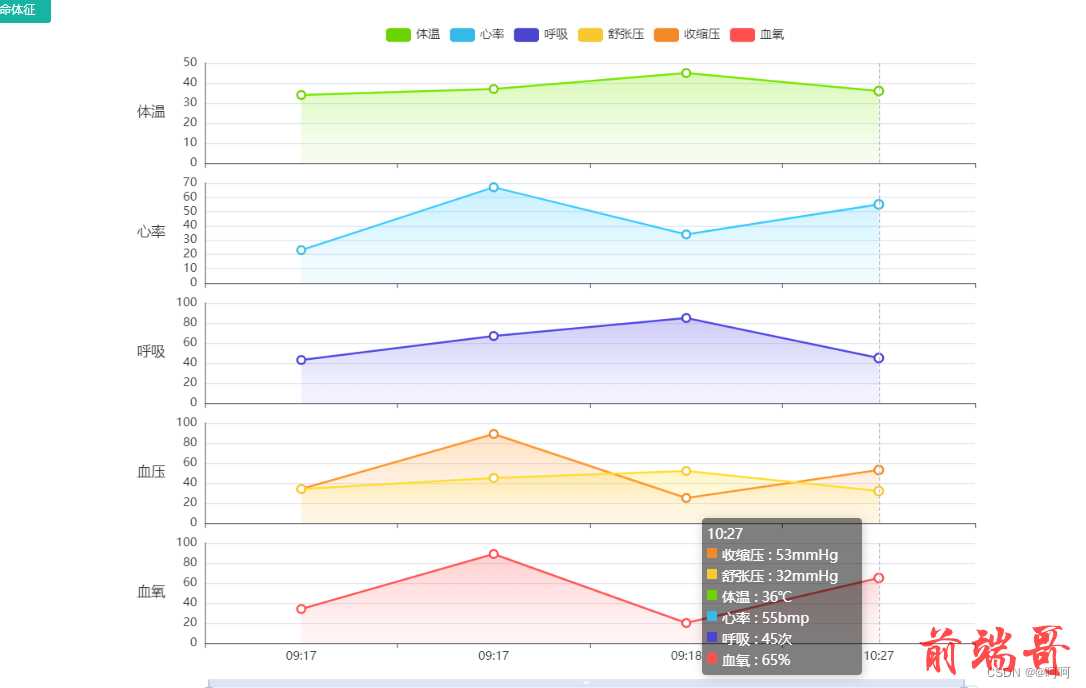
| this.overviewDate = [ |
| "16:32", |
| "16:32", |
| "16:55" |
| ] |
| this.bodyTemperatureList =[ 36, 39, 38] |
| |
| this.heartRateList = [ 85, 69, 99] |
| |
| this.breatheList =[ 74, 88, 65] |
| this.bloodPressureMaxList =[77, 88, 65 ] |
| this.bloodPressureMinList = [88, 88,65 ] |
| this.oxygenSaturationList =[74, 88, 56] |
| |
| |
| |
| chartFn() { |
| |
| const myChart = echarts.init(document.getElementById('echartsSigns')); |
| |
| const chartGridTop = 30; |
| const chartGridHeight = 100; |
| |
| |
| const option = { |
| animation: false, |
| legend: { |
| data: ['体温', '心率', '呼吸', '舒张压', '收缩压', '血氧'], |
| top: "0%", |
| |
| bottom: "50%", |
| icon: 'roundRect', |
| }, |
| tooltip: { |
| |
| trigger: 'axis', |
| transitionDuration: 0, |
| confine: true, |
| borderRadius: 4, |
| padding: 5, |
| borderWidth: 0, |
| backgroundColor: 'rgba(0, 0, 0,0.5)', |
| textStyle: { |
| fontSize: 14, |
| color: '#fff' |
| |
| }, |
| formatter: function (params) { |
| var relVal = params[0].name; |
| relVal += "<div style='width:150px;'>" |
| for (var i = 0, l = params.length; i < l; i++) { |
| if (params[i].seriesName === "体温") { |
| if (params[i].value) { |
| relVal += "<span style='display:inline-block;margin-right:5px;width:10px;height:10px;background-color:" + params[i].color + ";'>" + '<span style="display:block;padding-left:15px;margin-top:-4px">' + params[i].seriesName + ' : ' + params[i].value + '℃' + '</span>' + "</span>" + '<br>'; |
| } |
| } |
| if (params[i].seriesName === "心率") { |
| if (params[i].value) { |
| relVal += "<span style='display:inline-block;margin-right:5px;width:10px;height:10px;background-color:" + params[i].color + ";'>" + '<span style="display:block;padding-left:15px;margin-top:-4px">' + params[i].seriesName + ' : ' + params[i].value + 'bmp' + '</span>' + "</span>" + '<br>'; |
| } |
| } |
| if (params[i].seriesName === "呼吸") { |
| if (params[i].value) { |
| relVal += "<span style='display:inline-block;margin-right:5px;width:10px;height:10px;background-color:" + params[i].color + ";'>" + '<span style="display:block;padding-left:15px;margin-top:-4px">' + params[i].seriesName + ' : ' + params[i].value + '次' + '</span>' + "</span>" + '<br>'; |
| } |
| } |
| if (params[i].seriesName === "收缩压") { |
| if (params[i].value) { |
| relVal += "<span style='display:inline-block;margin-right:5px;width:10px;height:10px;background-color:" + params[i].color + ";'>" + '<span style="display:block;padding-left:15px;margin-top:-4px">' + params[i].seriesName + ' : ' + params[i].value + 'mmHg' + '</span>' + "</span>" + '<br>'; |
| } |
| } |
| if (params[i].seriesName === "舒张压") { |
| if (params[i].value) { |
| relVal += "<span style='display:inline-block;margin-right:5px;width:10px;height:10px;background-color:" + params[i].color + ";'>" + '<span style="display:block;padding-left:15px;margin-top:-4px">' + params[i].seriesName + ' : ' + params[i].value + 'mmHg' + '</span>' + "</span>" + '<br>'; |
| } |
| } |
| if (params[i].seriesName === "血氧") { |
| if (params[i].value) { |
| relVal += "<span style='display:inline-block;margin-right:5px;width:10px;height:10px;background-color:" + params[i].color + ";'>" + '<span style="display:block;padding-left:15px;margin-top:-4px">' + params[i].seriesName + ' : ' + params[i].value + '%' + '</span>' + "</span>" + '<br>'; |
| } |
| } |
| } |
| relVal += "</div>" |
| return relVal; |
| } |
| }, |
| |
| axisPointer: { |
| |
| link: { |
| xAxisIndex: 'all' |
| } |
| }, |
| |
| grid: [ |
| this.makeGrid(chartGridTop, chartGridHeight), |
| this.makeGrid(chartGridTop + (chartGridHeight + 20), chartGridHeight), |
| this.makeGrid(chartGridTop + (chartGridHeight + 20) * 2, chartGridHeight), |
| this.makeGrid(chartGridTop + (chartGridHeight + 20) * 3, chartGridHeight), |
| this.makeGrid(chartGridTop + (chartGridHeight + 20) * 4, chartGridHeight), |
| ], |
| xAxis: [ |
| this.makeXAxis(0), |
| this.makeXAxis(1), |
| this.makeXAxis(2), |
| this.makeXAxis(3), |
| this.makeXAxis(4), |
| ], |
| |
| yAxis: [ |
| this.makeYAxis(0, { |
| name: '体温', |
| |
| |
| }), |
| this.makeYAxis(1, { |
| name: '心率', |
| |
| }), |
| this.makeYAxis(2, { |
| name: '呼吸', |
| |
| }), |
| this.makeYAxis(3, { |
| name: '血压', |
| |
| |
| }), |
| this.makeYAxis(4, { |
| name: '血氧', |
| }), |
| |
| |
| ], |
| |
| dataZoom: [{ |
| type: 'slider', |
| xAxisIndex: [0, 1, 2, 3], |
| realtime: true, |
| |
| handleSize: '140%', |
| }], |
| |
| series: [ |
| this.makeGridData(0, 0, 'line', '体温', this.bodyTemperatureList, { |
| stack: 'DBTIME', smooth: false, color: '#6DD400', |
| |
| |
| |
| symbolSize: 8, |
| |
| showSymbol: false, |
| |
| |
| |
| |
| |
| |
| |
| areaStyle: { |
| color: new echarts.graphic.LinearGradient( |
| 0, |
| 0, |
| 0, |
| 1, |
| [ |
| { |
| offset: 0, |
| color: "rgba(109, 212, 0, 0.4)" |
| }, |
| { |
| offset: 0.8, |
| color: "rgba(109, 212, 0, 0.1)" |
| } |
| ], |
| false |
| ), |
| shadowColor: "rgba(0, 0, 0, 0.1)" |
| }, |
| }), |
| this.makeGridData(1, 1, 'line', '心率', this.heartRateList, { |
| smooth: false, color: '#35BAE9', |
| |
| |
| |
| symbolSize: 8, |
| |
| showSymbol: false, |
| |
| |
| |
| |
| |
| |
| areaStyle: { |
| color: new echarts.graphic.LinearGradient( |
| 0, |
| 0, |
| 0, |
| 1, |
| [ |
| { |
| offset: 0, |
| color: "rgba(53, 186, 233, 0.4)" |
| }, |
| { |
| offset: 0.8, |
| color: "rgba(53, 186, 233, 0.1)" |
| } |
| ], |
| false |
| ), |
| shadowColor: "rgba(0, 0, 0, 0.1)" |
| }, |
| }), |
| this.makeGridData(2, 2, 'line', '呼吸', this.breatheList, { |
| smooth: false, color: '#4A45CF', |
| |
| |
| |
| symbolSize: 8, |
| |
| showSymbol: false, |
| |
| |
| |
| |
| |
| |
| areaStyle: { |
| color: new echarts.graphic.LinearGradient( |
| 0, |
| 0, |
| 0, |
| 1, |
| [ |
| { |
| offset: 0, |
| color: "rgba(74, 69, 207, 0.4)" |
| }, |
| { |
| offset: 0.8, |
| color: "rgba(74, 69, 207, 0.1)" |
| } |
| ], |
| false |
| ), |
| shadowColor: "rgba(0, 0, 0, 0.1)" |
| }, |
| }), |
| this.makeGridData(3, 3, 'line', '收缩压', this.bloodPressureMaxList, { |
| smooth: false, color: '#F38A27', |
| |
| |
| |
| symbolSize: 8, |
| |
| showSymbol: false, |
| |
| |
| |
| |
| |
| |
| areaStyle: { |
| color: new echarts.graphic.LinearGradient( |
| 0, |
| 0, |
| 0, |
| 1, |
| [ |
| { |
| offset: 0, |
| color: "rgba(243, 138, 39, 0.4)" |
| }, |
| { |
| offset: 0.8, |
| color: "rgba(243, 138, 39, 0.1)" |
| } |
| ], |
| false |
| ), |
| shadowColor: "rgba(0, 0, 0, 0.1)" |
| }, |
| }), |
| this.makeGridData(3, 3, 'line', '舒张压', this.bloodPressureMinList, { |
| smooth: false, color: '#F7C92F', |
| |
| |
| |
| symbolSize: 8, |
| |
| showSymbol: false, |
| |
| |
| |
| |
| |
| |
| areaStyle: { |
| color: new echarts.graphic.LinearGradient( |
| 0, |
| 0, |
| 0, |
| 1, |
| [ |
| { |
| offset: 0, |
| color: "rgba(247, 201, 47, 0.4)" |
| }, |
| { |
| offset: 0.8, |
| color: "rgba(247, 201, 47, 0.1)" |
| } |
| ], |
| false |
| ), |
| shadowColor: "rgba(0, 0, 0, 0.1)" |
| }, |
| }), |
| this.makeGridData(4, 4, 'line', '血氧', this.oxygenSaturationList, {smooth: false, color: '#FF5050', |
| |
| |
| |
| symbolSize: 8, |
| |
| showSymbol: false, |
| |
| |
| |
| |
| |
| |
| areaStyle: { |
| color: new echarts.graphic.LinearGradient( |
| 0, |
| 0, |
| 0, |
| 1, |
| [ |
| { |
| offset: 0, |
| color: "rgba(255, 80, 80, 0.4)" |
| }, |
| { |
| offset: 0.8, |
| color: "rgba(255, 80, 80, 0.1)" |
| } |
| ], |
| false |
| ), |
| shadowColor: "rgba(0, 0, 0, 0.1)" |
| }, |
| }), |
| ] |
| } |
| myChart.setOption(option); |
| window.onresize = function () { |
| myChart.resize() |
| } |
| |
| }, |
| |
| makeGrid(top, height, opt) { |
| return echarts.util.merge({ |
| left: 70, |
| right: 60, |
| top: top, |
| height: height |
| }, opt || {}, true); |
| }, |
| |
| makeXAxis(gridIndex, opt) { |
| |
| this.axisLabelFlag = false; |
| |
| |
| |
| if (gridIndex == 4) { |
| this.axisLabelFlag = true; |
| } |
| return echarts.util.merge({ |
| type: 'category', |
| gridIndex: gridIndex, |
| |
| data: this.overviewDate, |
| |
| |
| |
| axisLabel: { |
| show: this.axisLabelFlag, |
| color: '#333333', |
| fontSize: '12', |
| fontWeight: 500 |
| }, |
| }, opt || {}, true); |
| }, |
| |
| makeYAxis(gridIndex, opt) { |
| return echarts.util.merge({ |
| type: 'value', |
| nameLocation: 'center', |
| nameGap: '40', |
| nameRotate: 0, |
| gridIndex: gridIndex, |
| nameTextStyle: { |
| color: '#333333', |
| fontSize: '14', |
| |
| }, |
| axisTick: { |
| show: false |
| }, |
| axisLabel: { |
| show: true, |
| textStyle: { |
| |
| baseline: 'middle', |
| color: '#333333', |
| fontSize: '12', |
| fontWeight: 500, |
| }, |
| }, |
| axisLine: { |
| show: true |
| } |
| }, opt || {}, true); |
| }, |
| |
| makeGridData(xAxisIndex, yAxisIndex, chartType, chartName, chartData, opt) { |
| return echarts.util.merge({ |
| type: chartType, |
| name: chartName, |
| xAxisIndex: xAxisIndex, |
| yAxisIndex: yAxisIndex, |
| data: chartData, |
| }, opt || {}, true); |
| } |
| |


