1.安装
2.main.js 导入
| |
| import * as echarts from 'echarts/core' |
| |
| import { BarChart, LineChart, PieChart, GaugeChart } from 'echarts/charts' |
| |
| import { GridComponent, TooltipComponent, LegendComponent, TitleComponent } from 'echarts/components' |
| |
| import { CanvasRenderer } from 'echarts/renderers' |
| |
| echarts.use( |
| [CanvasRenderer, BarChart, LineChart, PieChart, GaugeChart, GridComponent, TooltipComponent, LegendComponent, TitleComponent] |
| ) |
3. 使用
3.1 饼图

| <template> |
| <div class="op-data"> |
| <div :id="chartId" :style="{width: chartWidth, height: chartHeight}" /> |
| </div> |
| </template> |
| |
| <script> |
| import * as echarts from 'echarts' |
| export default { |
| name: 'OpData', |
| props: { |
| data: { |
| type: Array, |
| default: () => { |
| return [ |
| { value: 1048, name: 'Search Engine' }, |
| { value: 735, name: 'Direct' }, |
| { value: 580, name: 'Email' }, |
| { value: 484, name: 'Union Ads' }, |
| { value: 300, name: 'Video Ads' } |
| ] |
| } |
| } |
| }, |
| data () { |
| return { |
| chartId: 'op-data', |
| chartWidth: '', |
| chartHeight: '300px', |
| chartData: null |
| } |
| }, |
| watch: { |
| data: { |
| immediate: true, |
| deep: true, |
| handler: function (newVal, oldVal) { |
| if (newVal && newVal.length > 0) { |
| this.$nextTick(() => { |
| this.init() |
| }) |
| } |
| } |
| } |
| }, |
| mounted () { |
| }, |
| destroyed () { |
| this.destory() |
| }, |
| methods: { |
| init () { |
| if (this.chartData) { |
| this.destory() |
| } |
| const option = { |
| title: { |
| text: '运维数据分布', |
| textStyle: { |
| fontSize: '16' |
| }, |
| subtext: '人员处置事件图', |
| subtextStyle: { |
| fontSize: '12', |
| align: 'center' |
| }, |
| top: '5', |
| left: 'center' |
| }, |
| tooltip: { |
| trigger: 'item' |
| }, |
| legend: { |
| orient: 'vertical', |
| top: '5', |
| left: 'left' |
| }, |
| grid: { |
| top: '20px', |
| left: '5px', |
| right: '5px', |
| bottom: '0', |
| containLabel: true |
| }, |
| series: [ |
| { |
| name: 'Access From', |
| type: 'pie', |
| top: '50px', |
| center: ['50%', '50%'], |
| radius: '50%', |
| data: this.data, |
| emphasis: { |
| itemStyle: { |
| shadowBlur: 10, |
| shadowOffsetX: 0, |
| shadowColor: 'rgba(0, 0, 0, 0.5)' |
| } |
| } |
| } |
| ] |
| } |
| this.chartData = echarts.init(document.getElementById(this.chartId)) |
| this.chartData.clear() |
| this.chartData.setOption(option, true) |
| window.addEventListener('resize', this.chartData.resize, false) |
| |
| |
| |
| |
| |
| |
| |
| |
| |
| |
| |
| }, |
| destory () { |
| if (this.chartData) { |
| this.chartData.clear() |
| this.chartData.dispose() |
| this.chartData = null |
| } |
| } |
| } |
| } |
| </script> |
| <style lang="scss" scoped> |
| .op-data { |
| height: 100%; |
| max-height: 100%; |
| |
| } |
| </style> |
| |
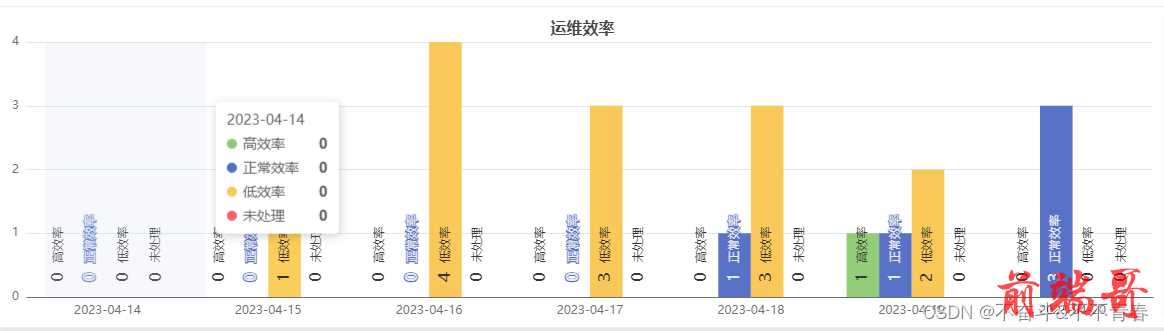
3.2 柱状图
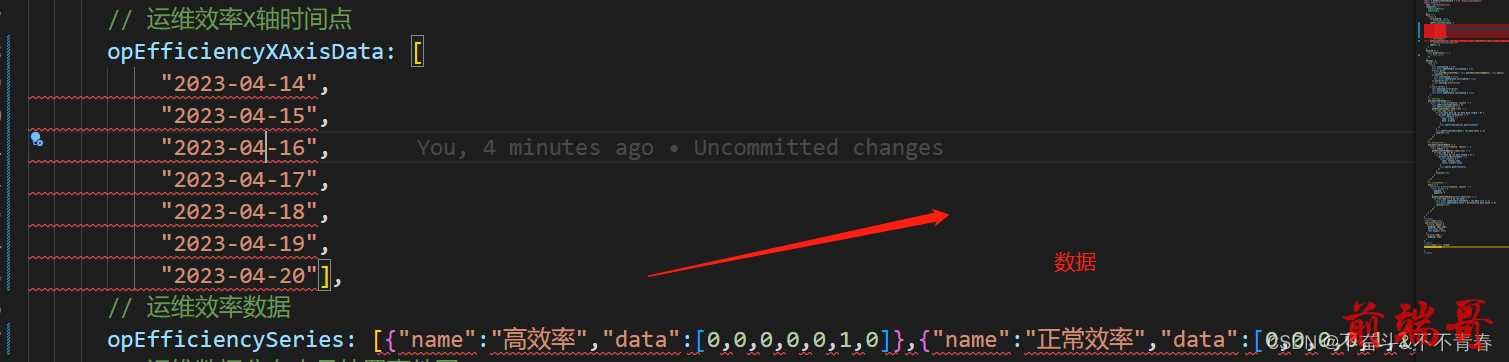
3.2.1 调用图表组件代码
| |
| opEfficiencyXAxisData: [ |
| "2023-04-14", |
| "2023-04-15", |
| "2023-04-16", |
| "2023-04-17", |
| "2023-04-18", |
| "2023-04-19", |
| "2023-04-20"], |
| |
| opEfficiencySeries: [{"name":"高效率","data":[0,0,0,0,0,1,0]},{"name":"正常效率","data":[0,0,0,0,1,1,3]},{"name":"低效率","data":[0,1,4,3,3,2,0]},{"name":"未处理","data":[0,0,0,0,0,0,0]}], |
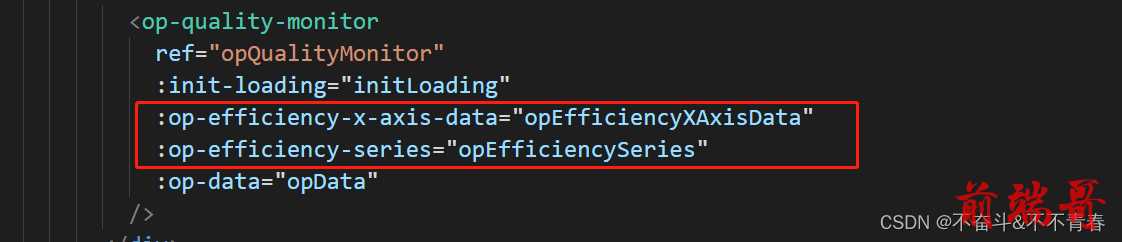
3.2.2 图表组件代码
| <template> |
| <div :class="initLoading ? 'op-efficiency' : 'op-efficiency-nodata'"> |
| <span v-if="initLoading" class="loading-text">加载中...</span> |
| <el-empty v-else-if="!initLoading && data.length <= 0" :image-size="100" /> |
| <div :id="chartId" :style="{width: chartWidth, height: chartHeight}" /> |
| </div> |
| </template> |
| |
| <script> |
| import * as echarts from 'echarts' |
| export default { |
| name: 'OpEfficiency', |
| props: { |
| initLoading: { |
| type: Boolean, |
| default: false |
| }, |
| xAxisData: { |
| type: Array, |
| default: () => { |
| return [] |
| } |
| }, |
| data: { |
| type: Array, |
| default: () => { |
| } |
| } |
| }, |
| data () { |
| return { |
| chartId: 'op-efficiency', |
| chartWidth: '', |
| chartHeight: '300px', |
| chartData: null, |
| seriesData: [], |
| colorList: ['#5470c6', '#91cc75', '#fac858', '#ee6666', '#73c0de', '#3ba272', '#fc8452', '#9a60b4', '#ea7ccc'] |
| } |
| }, |
| watch: { |
| data: { |
| immediate: true, |
| deep: true, |
| handler: function (newVal, oldVal) { |
| if (newVal && newVal.length > 0) { |
| this.$nextTick(() => { |
| this.init() |
| }) |
| } |
| } |
| } |
| }, |
| mounted () { |
| }, |
| destroyed () { |
| this.destory() |
| }, |
| methods: { |
| init () { |
| if (this.chartData) { |
| this.destory() |
| } |
| const posList = [ |
| 'left', |
| 'right', |
| 'top', |
| 'bottom', |
| 'inside', |
| 'insideTop', |
| 'insideLeft', |
| 'insideRight', |
| 'insideBottom', |
| 'insideTopLeft', |
| 'insideTopRight', |
| 'insideBottomLeft', |
| 'insideBottomRight' |
| ] |
| var app = {} |
| app.configParameters = { |
| rotate: { |
| min: -90, |
| max: 90 |
| }, |
| align: { |
| options: { |
| left: 'left', |
| center: 'center', |
| right: 'right' |
| } |
| }, |
| verticalAlign: { |
| options: { |
| top: 'top', |
| middle: 'middle', |
| bottom: 'bottom' |
| } |
| }, |
| position: { |
| options: posList.reduce(function (map, pos) { |
| map[pos] = pos |
| return map |
| }, {}) |
| }, |
| distance: { |
| min: 0, |
| max: 100 |
| } |
| } |
| app.config = { |
| rotate: 90, |
| align: 'left', |
| verticalAlign: 'middle', |
| position: 'insideBottom', |
| distance: 15, |
| onChange: function () { |
| const labelOption = { |
| rotate: app.config.rotate, |
| align: app.config.align, |
| verticalAlign: app.config.verticalAlign, |
| position: app.config.position, |
| distance: app.config.distance |
| } |
| this.chartData.setOption({ |
| series: [ |
| { |
| label: labelOption |
| }, |
| { |
| label: labelOption |
| }, |
| { |
| label: labelOption |
| }, |
| { |
| label: labelOption |
| } |
| ] |
| }) |
| } |
| } |
| let labelOption = { |
| show: true, |
| position: app.config.position, |
| distance: app.config.distance, |
| align: app.config.align, |
| verticalAlign: app.config.verticalAlign, |
| rotate: app.config.rotate, |
| formatter: '{c} {name|{a}}', |
| fontSize: 16, |
| rich: { |
| name: {} |
| }, |
| textStyle: { |
| color: null |
| } |
| } |
| |
| this.data.forEach((e) => { |
| e.color = this.getColorByName(e.name) |
| |
| e.labelOption = JSON.parse(JSON.stringify(labelOption)) |
| }) |
| this.setSeries() |
| const option = { |
| title: { |
| text: '运维效率', |
| textStyle: { |
| fontSize: '16' |
| }, |
| left: 'center' |
| }, |
| tooltip: { |
| trigger: 'axis', |
| axisPointer: { |
| type: 'shadow' |
| } |
| }, |
| xAxis: [ |
| { |
| type: 'category', |
| axisTick: { show: false }, |
| data: this.xAxisData |
| } |
| ], |
| yAxis: [ |
| { |
| type: 'value' |
| } |
| ], |
| grid: { |
| top: '25px', |
| left: '5px', |
| right: '5px', |
| bottom: '0', |
| containLabel: true |
| }, |
| series: this.seriesData |
| } |
| this.chartData = echarts.init(document.getElementById(this.chartId)) |
| this.chartData.clear() |
| this.chartData.setOption(option, true) |
| window.addEventListener('resize', this.chartData.resize, false) |
| }, |
| setSeries () { |
| this.seriesData = [] |
| this.data.forEach(item => { |
| const that = this |
| const tempSeries = { |
| type: 'bar', |
| barGap: 0, |
| label: item.labelOption, |
| emphasis: { |
| focus: 'series' |
| }, |
| name: item.name, |
| data: item.data, |
| itemStyle: { |
| normal: { |
| |
| color: function (params) { |
| const colorList = that.colorList |
| if (params.dataIndex >= colorList.length) { |
| params.dataIndex = params.dataIndex - colorList.length |
| } |
| const color = that.getColorByName(params.seriesName) |
| if (color) { |
| return color |
| } |
| return colorList[params.dataIndex] |
| } |
| } |
| } |
| } |
| that.seriesData.push(tempSeries) |
| }) |
| }, |
| |
| getColorByName (name) { |
| let color = null |
| |
| if (name === '低效率') { |
| color = this.colorList[2] |
| } else if (name === '高效率') { |
| color = this.colorList[1] |
| } else if (name === '正常效率') { |
| color = this.colorList[0] |
| } else if (name === '未处理') { |
| color = this.colorList[3] |
| } |
| console.log('color', color) |
| return color |
| }, |
| |
| destory () { |
| if (this.chartData) { |
| this.chartData.clear() |
| this.chartData.dispose() |
| this.chartData = null |
| } |
| } |
| } |
| } |
| </script> |
| <style lang="scss" scoped> |
| @mixin op-efficiency { |
| height: 100%; |
| max-height: 100%; |
| .loading-text { |
| color: #409EFF; |
| } |
| } |
| .op-efficiency { |
| @include op-efficiency(); |
| line-height: 300px; |
| text-align: center; |
| } |
| .op-efficiency-nodata { |
| @include op-efficiency(); |
| .el-empty { |
| padding: calc((300px - 120px) / 2); |
| } |
| } |
| </style> |
| |


