Echarts 柱状图 设置柱状图渐变,设置柱状图圆角(弧度)
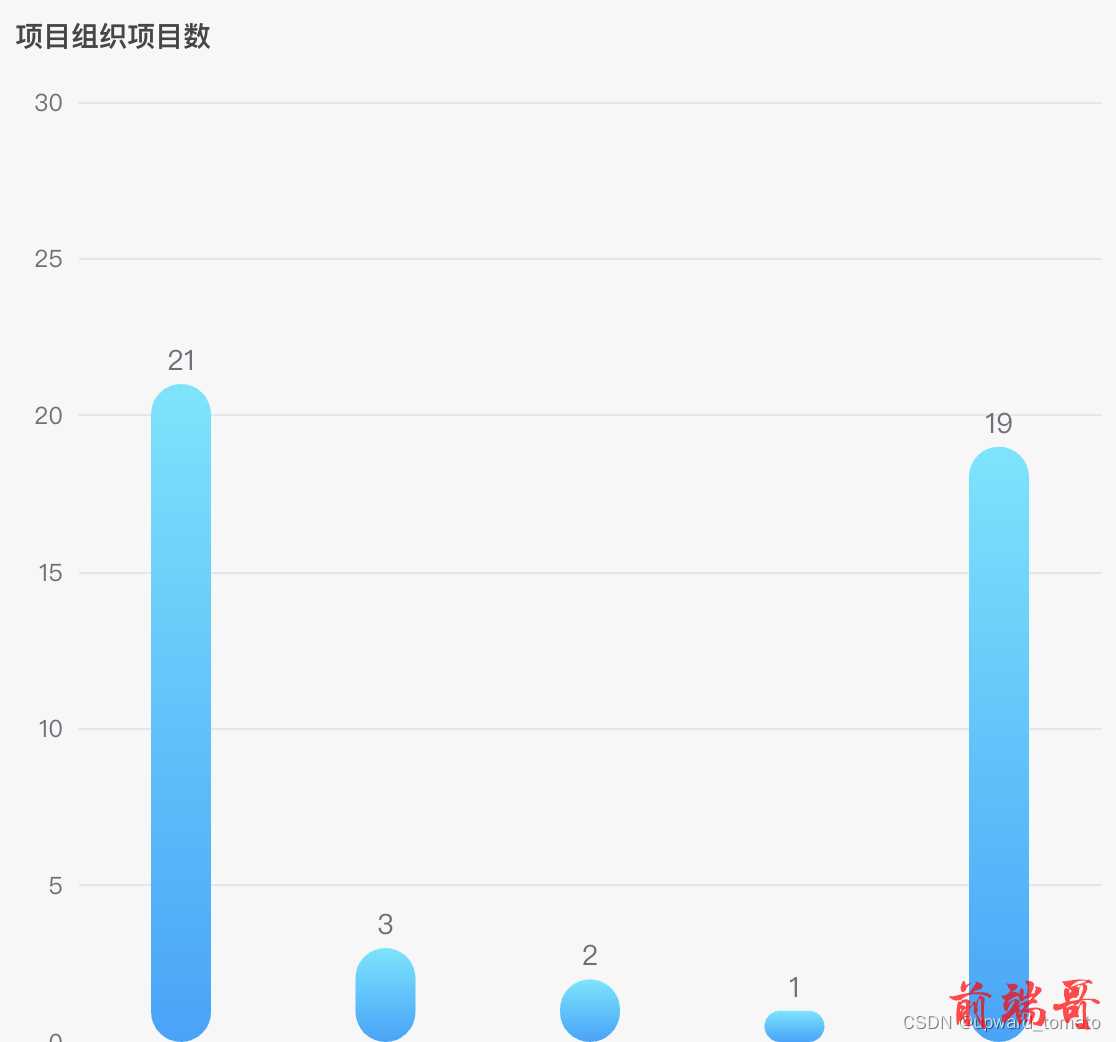
1. 效果截图
2. 配置项截图

3. 具体代码
| import * as echarts from 'echarts' |
| |
| |
| const territoryOptions = { |
| key: 'territory', |
| title: { |
| text: '项目数', |
| textStyle: { |
| fontSize: 14 |
| }, |
| padding: [20, 32] |
| }, |
| color: ['#A4CDEB', '#F2D378'], |
| legend: { |
| bottom: '10%' |
| }, |
| tooltip: { |
| trigger: 'item', |
| formatter: '{b} : 数量{c}' |
| }, |
| xAxis: [ |
| { |
| type: 'category', |
| |
| data: [] |
| } |
| ], |
| yAxis: [ |
| { |
| type: 'value', |
| max: function(value) { |
| return Math.round((value.max + value.max * 0.4) / 10) * 10 |
| } |
| } |
| ], |
| dataZoom: { |
| startValue: 0, |
| endValue: 4, |
| type: 'slider', |
| height: '15px' |
| }, |
| series: [ |
| { |
| type: 'bar', |
| data: [], |
| barWidth: 30, |
| emphasis: { |
| barBorderRadius: 30 |
| }, |
| itemStyle: { |
| normal: { |
| barBorderRadius: 30, |
| label: { |
| show: true, |
| position: 'top', |
| textStyle: { |
| |
| color: '#6E7079', |
| fontSize: 14 |
| } |
| }, |
| color: new echarts.graphic.LinearGradient(0, 0, 0, 1, [ |
| { offset: 0, color: '#51e7ff' }, |
| { offset: 1, color: '#05a6ff' } |
| ]) |
| } |
| } |
| } |
| ] |
| } |


