
1.饼形图
1.1图表示例
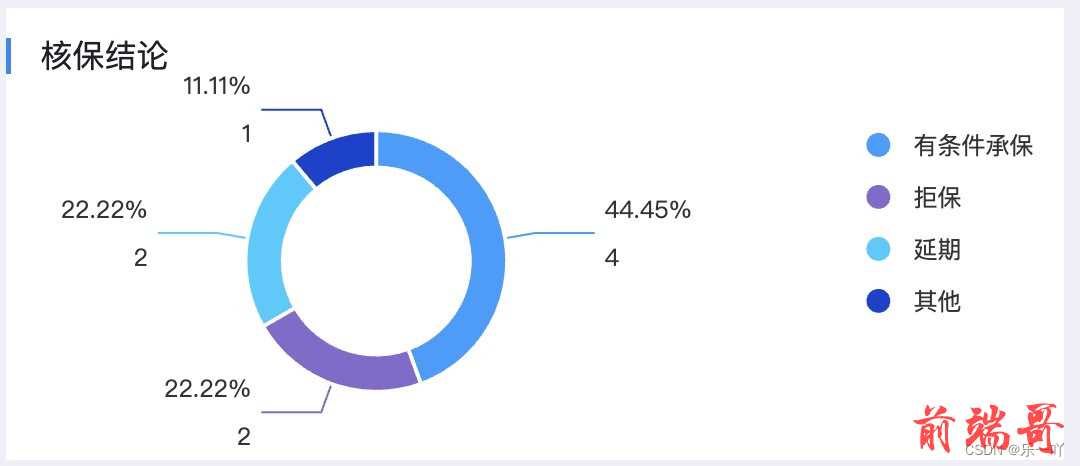
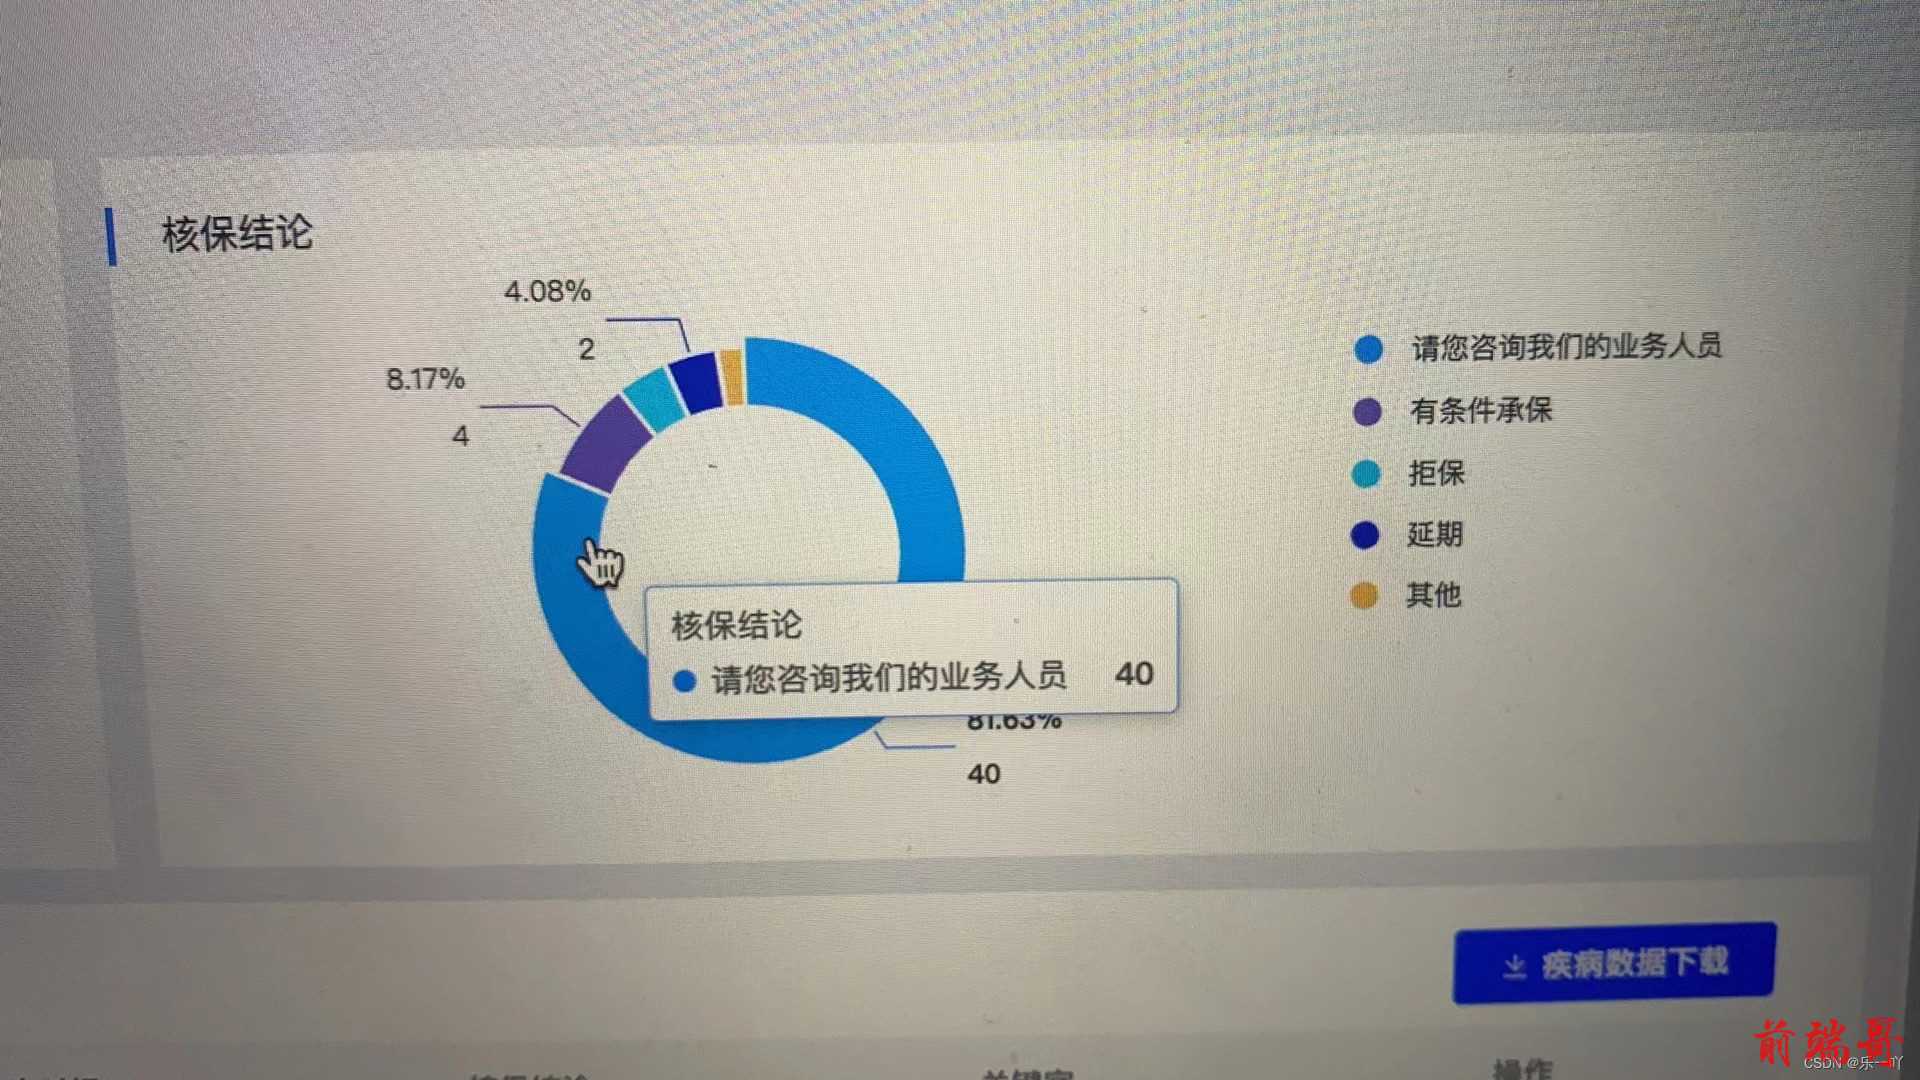
1.1配置选项
//配置项手册 1.tooltip:鼠标hover上去显示的内容 2.lengend:对应图例,也就是请您咨询我们的业务人员、有条件承保、拒保、延期、其他 3.title:显示在饼形图内的,暂时未在图上进行显示,因我司ui未要求
async drawConclusion(dom){ let dateObj = { start_time_int:this.selectDate[0]/1000, end_time_int:this.selectDate[1]/1000 } let HBData = {} await getHBStatistics(dateObj).then(res=>{ let result = res.data if(result.status === 200){ let data = result.data if(data.length > 0){ this.noDataHBText = '' HBData = data.map(item=>{ return { name:item['conclusion_name'], value:item['count'], conclusion_code: item['conclusion_code'] } }) // HBData.sort(this.sorted('value')) // console.log(HBData,'获取到的数据'); const option = { color:[ '#249EFF','#846BCE','#21CCFF','#0E42D2','#FDBF5E','#0081FF','#8291A9','#805EFD'], tooltip: { trigger: 'item' }, legend: { // x:"70%", orient:'vertical', y:"12%", x:'68%', icon:'circle' }, title: { // text: '总计', x: '30%', y: '38%', textStyle: { fontWeight: 'normal', color: '#4E5969', fontSize: 14 }, // subtext:'928531', subtextStyle: { fontSize: 16, fontWeight: 'bold', }, }, series: [ { name: '核保结论', type: 'pie', radius: ['50%', '70%'], center: ['35%', '50%'], avoidLabelOverlap: true, //是否启用防止标签重叠策略 minAngle: 20,//最小的扇区角度(0 ~ 360),用于防止某个值过小导致扇区太小影响交互 emphasis:{ shadowBlur: 10, shadowOffsetX: 0, shadowColor: 'rgba(0, 0, 0, 0.5)' }, label: { show: false, normal: { show: true, lineHeight:10, // position: 'inside', formatter: '{d}%\n\n{c}', //自定义显示格式(b:name, c:value, d:百分比) fontSize: 12 // 字体大小 }, rich:{ } }, emphasis: { label: { show: true, fontSize: 12, fontWeight: 'bold', } }, labelLine: { length: 20, // 挨着图例的直线的长度 length2: 50 // 挨着文字的直线的长度 // normal:true }, itemStyle: { borderColor: '#fff', borderWidth: 2 }, data:HBData, } ] }; // 使用刚指定的配置项和数据显示图表。 dom.setOption(option); //随着屏幕大小调节图表 window.addEventListener("resize", () => { dom.resize(); }); }else{ this.noDataHBText = this.tips } }else{ this.$message({ message:result.message, type:'warning', duration:2000, showClose: true }) } }) },
2.柱形图
2.1图表示例
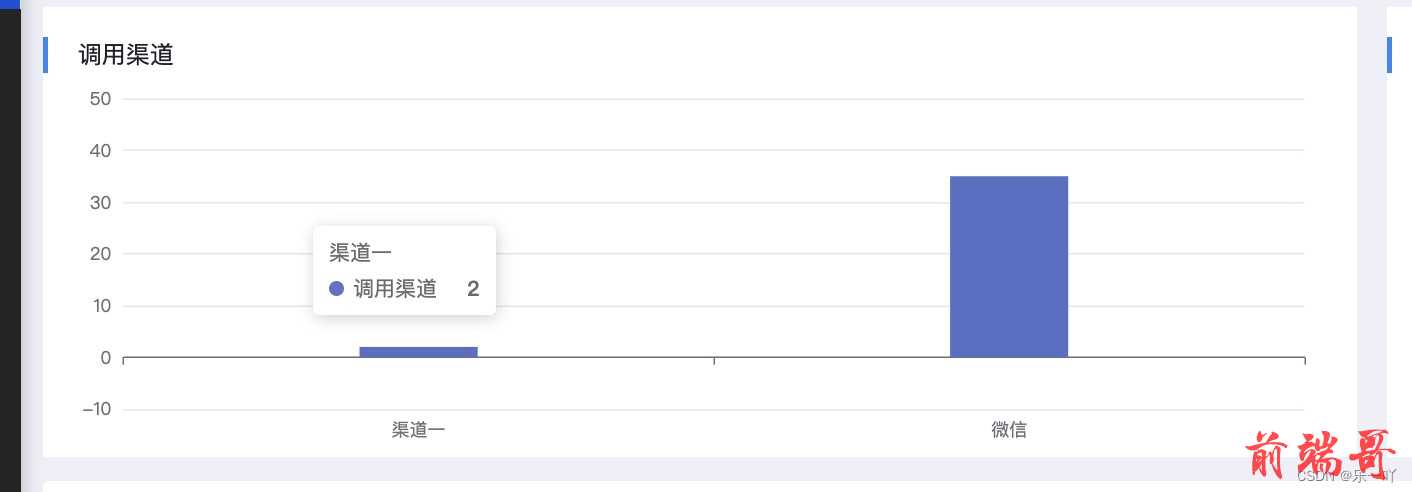
2.2配置选项
async drawChannel(dom){ let dateObj = { start_time_int:this.selectDate[0]/1000, end_time_int:this.selectDate[1]/1000 } let channelNameData = [] let channelValueData = [] await getchannelCallStatistics(dateObj).then(res=>{ let result = res.data if(result.status === 200){ let data = result.data console.log(data.length); if(data.length > 0){ this.noDataChannelText = '' data.map(item=>{ channelNameData.push(item.channel_no) channelValueData.push(item.count) }) const option = { tooltip: { trigger: 'axis', axisPointer: { type: 'shadow' } }, grid: { left: '3%', right: '4%', bottom: '0%', top:'7%', containLabel: true }, xAxis: { type: 'category', data: channelNameData, }, yAxis: { type: 'value', // min:0, // max:29034, // splitNumber:5000, boundaryGap : [ 0.2, 0.2 ] }, series: [ { name: '调用渠道', type: 'bar', barWidth: '20%', data: channelValueData, }, ] } // 使用刚指定的配置项和数据显示图表。 dom.setOption(option); //随着屏幕大小调节图表 window.addEventListener("resize", () => { dom.resize(); }); }else{ this.noDataChannelText = this.tips } }else{ this.$message({ message:result.message, type:'warning', duration:2000, showClose: true }) } }) }

