ECharts-折线图
- 前言
- 折线图特点
- 折线图实现步骤
- 折线图常见效果
- 标记
- 线条控制
- 填充风格
- 紧挨边缘
- 缩放, 脱离0值比例
- 堆叠图
前言
折线图特点
折线图实现步骤
- ECharts 最基本的代码结构
- 准备x轴的数据
- 准备 y 轴的数据
- 准备 option , 将 series 中的 type 的值设置为: line
| <!DOCTYPE html> |
| <html lang="en"> |
| |
| <head> |
| <meta charset="UTF-8"> |
| <meta name="viewport" content="width=device-width, initial-scale=1.0"> |
| <meta http-equiv="X-UA-Compatible" content="ie=edge"> |
| <title>ECharts-折线图</title> |
| |
| <script src="https://cdn.jsdelivr.net/npm/echarts@5.4.1/dist/echarts.min.js"></script> |
| </head> |
| |
| <body> |
| |
| <div id='app' style="width: 600px;height: 400px"></div> |
| <script> |
| |
| var myCharts = echarts.init(document.getElementById('app')) |
| |
| var xDataArr = ['张三', '李四', '王五', '闰土', '小明', '茅台', '球球'] |
| |
| var yDataArr = [88, 92, 63, 77, 94, 80, 72] |
| |
| var option = { |
| xAxis: { |
| type: 'category', |
| data: xDataArr |
| }, |
| yAxis: { |
| type: 'value' |
| }, |
| series: [ |
| { |
| type: 'line', |
| data: yDataArr |
| } |
| ] |
| } |
| |
| myCharts.setOption(option) |
| </script> |
| </body> |
| |
| </html> |
- 效果
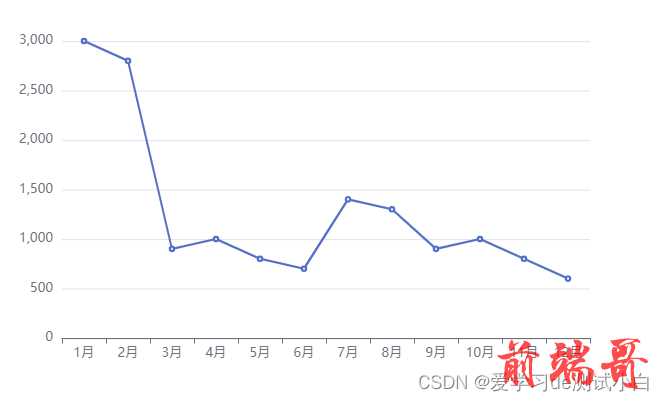
折线图常见效果
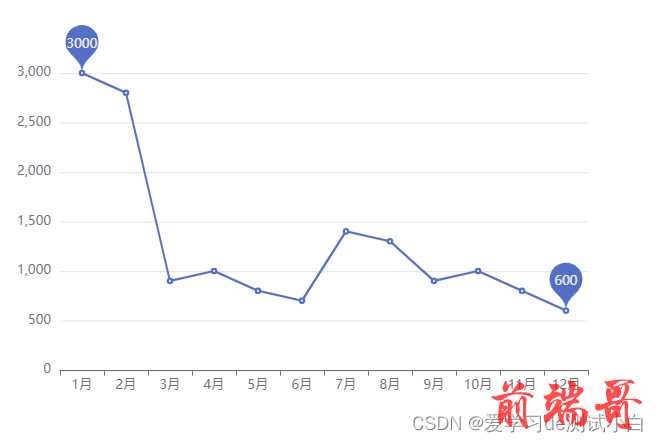
标记
| markPoint: { |
| data: [ |
| { |
| type: 'max', |
| name: '最大值' |
| }, { |
| type: 'min', |
| name: '最小值' |
| } |
| ] |
| } |
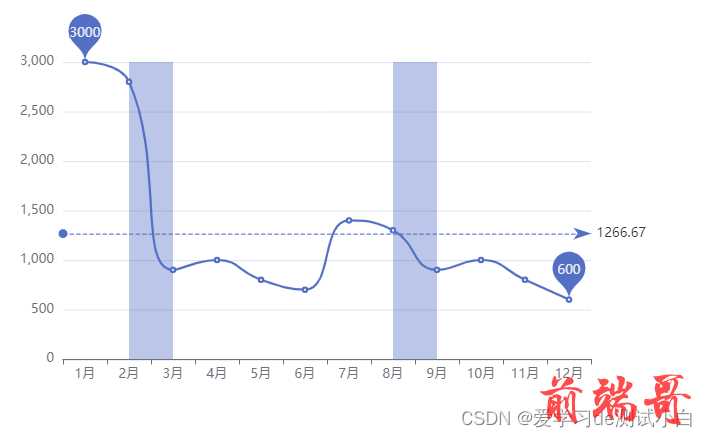
| markLine: { |
| data: [ |
| { |
| type: 'average', |
| name: '平均值' |
| } |
| ] |
| } |

| markArea: { |
| data: [ |
| [{xAxis: '2月'}, {xAxis: '3月'}], |
| [{xAxis: '8月'}, {xAxis: '9月'}] |
| ] |
| } |
线条控制
| var option = { |
| series: [ |
| { |
| ...... |
| smooth: true |
| } |
| ] |
| } |
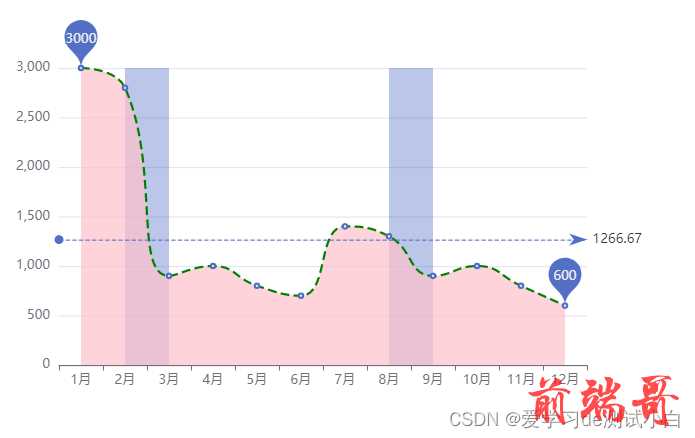
| var option = { |
| series: [ |
| { |
| ...... |
| lineStyle: { |
| color: 'green', |
| type: 'dashed' |
| } |
| } |
| ] |
| } |

填充风格
| var option = { |
| series: [ |
| { |
| type: 'line', |
| data: yDataArr, |
| areaStyle: { |
| color: 'pink' |
| } |
| } |
| ] |
| } |
紧挨边缘
- boundaryGap:是设置给 x 轴的, 让起点从 x 轴的0坐标开始
| var option = { |
| xAxis: { |
| type: 'category', |
| data: xDataArr, |
| boundaryGap: false |
| } |
| } |
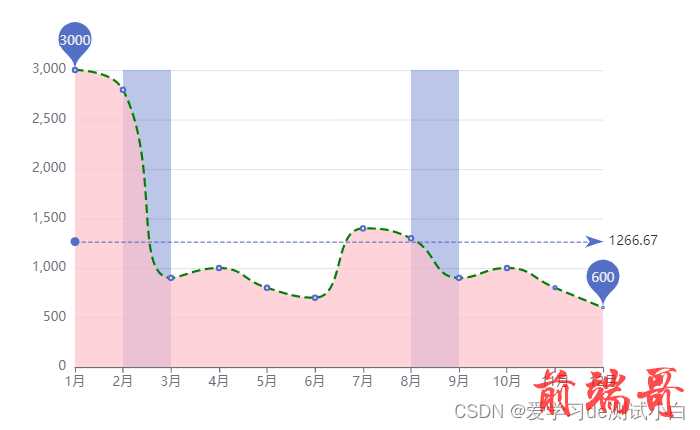
| <!DOCTYPE html> |
| <html lang="en"> |
| |
| <head> |
| <meta charset="UTF-8"> |
| <meta name="viewport" content="width=device-width, initial-scale=1.0"> |
| <meta http-equiv="X-UA-Compatible" content="ie=edge"> |
| <title>ECharts-折线图</title> |
| |
| <script src="https://cdn.jsdelivr.net/npm/echarts@5.4.1/dist/echarts.min.js"></script> |
| </head> |
| |
| <body> |
| |
| <div id='app' style="width: 600px;height: 400px"></div> |
| <script> |
| |
| var myCharts = echarts.init(document.getElementById('app')) |
| |
| var xDataArr = ['1月', '2月', '3月', '4月', '5月', '6月', '7月', '8月', '9月', |
| '10月', '11月', '12月'] |
| |
| var yDataArr = [3000, 2800, 900, 1000, 800, 700, 1400, 1300, 900, 1000, 800, |
| 600] |
| var yDataArr1 = [3005, 3003, 3001, 3002, 3009, 3007, 3003, 3001, 3005, |
| 3004, 3001, 3009] |
| |
| var option = { |
| xAxis: { |
| type: 'category', |
| data: xDataArr, |
| boundaryGap: false |
| }, |
| yAxis: { |
| type: 'value', |
| scale: true |
| }, |
| series: [ |
| { |
| type: 'line', |
| data: yDataArr, |
| scale: true, |
| markPoint: { |
| data: [ |
| { |
| type: 'max', |
| name: '最大值' |
| }, { |
| type: 'min', |
| name: '最小值' |
| } |
| ] |
| }, |
| markLine: { |
| data: [ |
| { |
| type: 'average', |
| name: '平均值' |
| } |
| ] |
| }, |
| markArea: { |
| data: [ |
| [{xAxis: '2月'}, {xAxis: '3月'}], |
| [{xAxis: '8月'}, {xAxis: '9月'}] |
| ] |
| }, |
| smooth: true, |
| lineStyle: { |
| color: 'green', |
| type: 'dashed' |
| }, |
| areaStyle: { |
| color: 'pink' |
| } |
| } |
| ] |
| } |
| |
| myCharts.setOption(option) |
| </script> |
| </body> |
| |
| </html> |
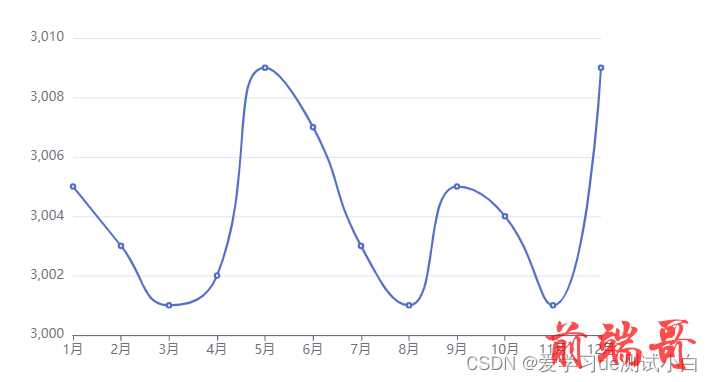
缩放, 脱离0值比例
- 如果每一组数据之间相差较少, 且都比0大很多, 那么有可能会出现这种情况
- scale :应该配置给 y 轴
| var option = { |
| yAxis: { |
| type: 'value', |
| scale: true |
| } |
| } |
| <!DOCTYPE html> |
| <html lang="en"> |
| |
| <head> |
| <meta charset="UTF-8"> |
| <meta name="viewport" content="width=device-width, initial-scale=1.0"> |
| <meta http-equiv="X-UA-Compatible" content="ie=edge"> |
| <title>ECharts-折线图</title> |
| |
| <script src="https://cdn.jsdelivr.net/npm/echarts@5.4.1/dist/echarts.min.js"></script> |
| </head> |
| |
| <body> |
| |
| <div id='app' style="width: 600px;height: 400px"></div> |
| <script> |
| |
| var myCharts = echarts.init(document.getElementById('app')) |
| |
| var xDataArr = ['1月', '2月', '3月', '4月', '5月', '6月', '7月', '8月', '9月', |
| '10月', '11月', '12月'] |
| |
| var yDataArr = [3000, 2800, 900, 1000, 800, 700, 1400, 1300, 900, 1000, 800, |
| 600] |
| var yDataArr1 = [3005, 3003, 3001, 3002, 3009, 3007, 3003, 3001, 3005, |
| 3004, 3001, 3009] |
| |
| var option = { |
| xAxis: { |
| type: 'category', |
| data: xDataArr, |
| boundaryGap: false |
| }, |
| yAxis: { |
| type: 'value', |
| scale: true |
| }, |
| series: [ |
| { |
| type: 'line', |
| data: yDataArr1, |
| smooth: true, |
| } |
| ] |
| } |
| |
| myCharts.setOption(option) |
| </script> |
| </body> |
| |
| </html> |
- 效果
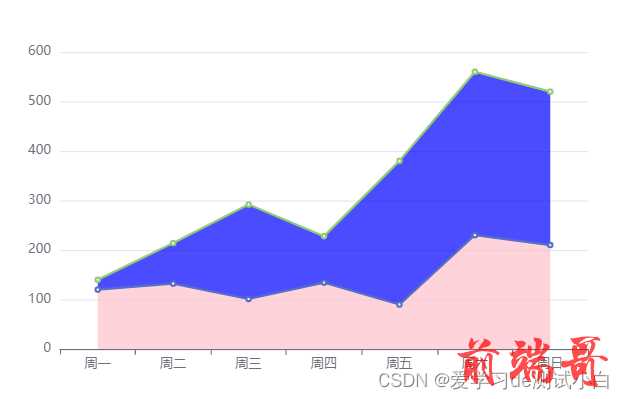
堆叠图
- 堆叠图指的是, 同个类目轴上系列配置相同的 stack 值后,后一个系列的值会在前一个系列的值上
相加
| var option = { |
| series: [ |
| { |
| type: 'line', |
| data: yDataArr1, |
| stack: 'all' |
| |
| }, |
| { |
| type: 'line', |
| data: yDataArr2, |
| stack: 'all' |
| } |
| ] |
| } |
- 效果
- 完整代码
| <!DOCTYPE html> |
| <html lang="en"> |
| |
| <head> |
| <meta charset="UTF-8"> |
| <meta name="viewport" content="width=device-width, initial-scale=1.0"> |
| <meta http-equiv="X-UA-Compatible" content="ie=edge"> |
| <title>ECharts-折线图</title> |
| |
| <script src="https://cdn.jsdelivr.net/npm/echarts@5.4.1/dist/echarts.min.js"></script> |
| </head> |
| |
| <body> |
| |
| <div id='app' style="width: 600px;height: 400px"></div> |
| <script> |
| |
| var myCharts = echarts.init(document.getElementById('app')) |
| var xDataArr = ['周一', '周二', '周三', '周四', '周五', '周六', '周日'] |
| var yDataArr1 = [120, 132, 101, 134, 90, 230, 210] |
| var yDataArr2 = [20, 82, 191, 94, 290, 330, 310] |
| |
| var option = { |
| xAxis: { |
| type: 'category', |
| data: xDataArr |
| }, |
| yAxis: { |
| type: 'value', |
| scale: true |
| }, |
| series: [ |
| { |
| type: 'line', |
| data: yDataArr1, |
| stack: 'all', |
| areaStyle: { |
| color: 'pink' |
| } |
| }, |
| { |
| type: 'line', |
| data: yDataArr2, |
| stack: 'all', |
| areaStyle: { |
| color: 'blue' |
| } |
| } |
| ] |
| } |
| myCharts.setOption(option) |
| |
| myCharts.setOption(option) |
| </script> |
| </body> |
| |
| </html> |
| |


