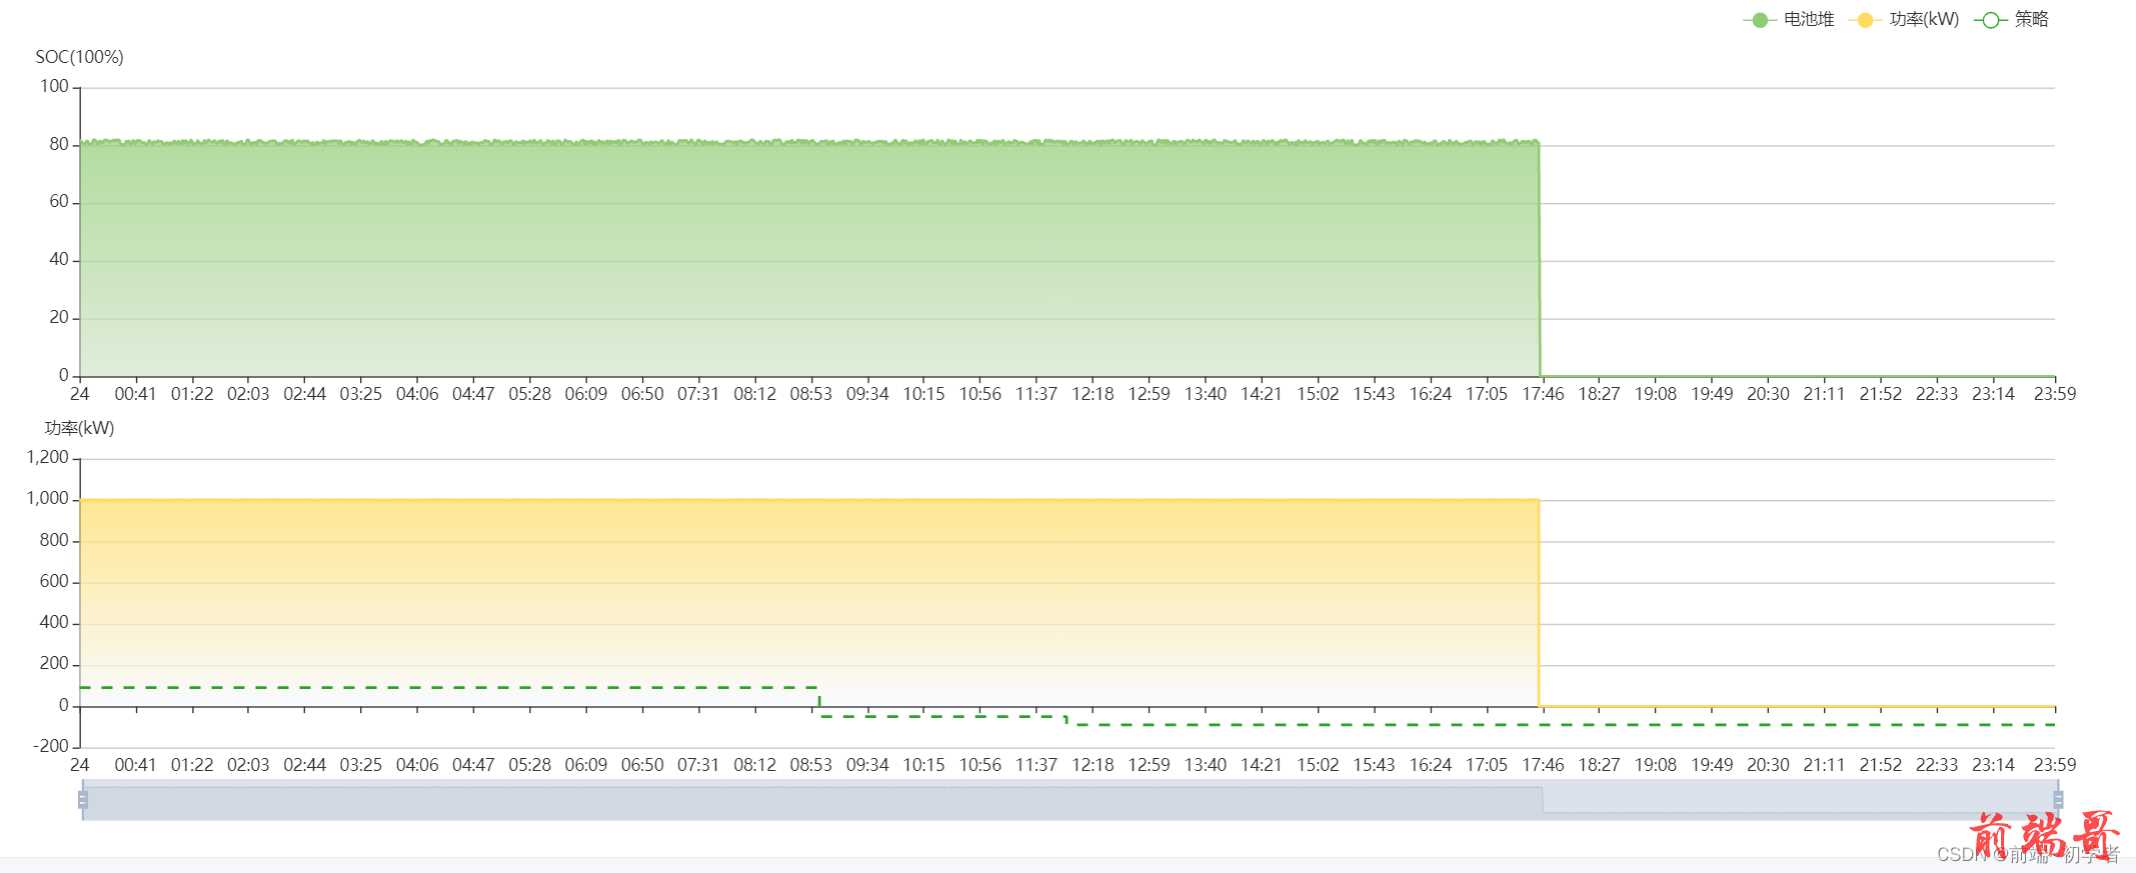
Echarts之series动态渲染多个折线图/面积图
- 1、根据后端返回数据(数组)动态设置series
- 2、根据得到的多组series数据进行画图
由于工作中遇到的图表特别多,每次用过配置项总是想不起来,在这里记录一下,希望也可以帮到路过的你。话不多说我们上图:
1、根据后端返回数据(数组)动态设置series
| const socSeries = this.setSeries(res.result.socFollowingList) |
| setSeries (data) { |
| const colors = [ |
| { |
| zero: '#91cc75', |
| one: '#D3E5CB' |
| }, |
| { |
| zero: '#5470c6', |
| one: '#C4CBED' |
| }, |
| { |
| zero: '#ee6666', |
| one: '#E3B7B7' |
| }, |
| { |
| zero: '#7a22ef', |
| one: '#C9B7E3' |
| }, |
| { |
| zero: '#3bbcd9', |
| one: '#B9E0E8' |
| } |
| ] |
| var series = [] |
| var series_data = data |
| series_data.forEach((e, index) => { |
| let value = e.list.map(item => { |
| return item.val |
| }) |
| var item = { |
| name: e.name, |
| data: value, |
| type: 'line', |
| symbol: 'none', |
| itemStyle: { |
| color: colors[index].zero |
| }, |
| areaStyle: { |
| color: new echarts.graphic.LinearGradient(0, 0, 0, 1, [ |
| { |
| offset: 0, |
| color: colors[index].zero |
| }, |
| { |
| offset: 1, |
| color: colors[index].one |
| } |
| ]) |
| }, |
| } |
| series.push(item) |
| }) |
| return series |
| }, |
2、根据得到的多组series数据进行画图
| this.getPowerTracking(timeData, socSeries, power, strategy) |
| getPowerTracking (timeData, socSeries, power, strategy) { |
| let myChartDom = document.getElementById('chart-power') |
| let myChart = echarts.init(myChartDom) |
| var option |
| |
| option = { |
| tooltip: { |
| trigger: 'axis', |
| axisPointer: { |
| animation: false |
| } |
| }, |
| legend: { |
| |
| right: 50 |
| }, |
| axisPointer: { |
| link: [ |
| { |
| xAxisIndex: 'all' |
| } |
| ] |
| }, |
| dataZoom: [ |
| { |
| show: true, |
| realtime: true, |
| start: 30, |
| end: 70, |
| xAxisIndex: [0, 1] |
| }, |
| { |
| type: 'inside', |
| realtime: true, |
| start: 30, |
| end: 70, |
| xAxisIndex: [0, 1] |
| } |
| ], |
| grid: [ |
| { |
| left: 60, |
| right: 50, |
| height: '35%' |
| }, |
| { |
| left: 60, |
| right: 50, |
| top: '55%', |
| height: '35%' |
| } |
| ], |
| xAxis: [ |
| { |
| type: 'category', |
| boundaryGap: false, |
| axisLine: { onZero: true }, |
| data: timeData, |
| axisLabel: { |
| show: true, |
| showMaxLabel: true, |
| showMinLabel: true, |
| formatter: function (value, index) { |
| var date = new Date(value) |
| |
| |
| |
| |
| if (date.getHours() === 0 && date.getMinutes() === 0) { |
| |
| return date.getDate() |
| } else { |
| const hours = date.getHours().toString().padStart(2, '0') |
| const minutes = date.getMinutes().toString().padStart(2, '0') |
| return `${hours}:${minutes}` |
| } |
| } |
| }, |
| }, |
| { |
| gridIndex: 1, |
| type: 'category', |
| |
| boundaryGap: false, |
| axisLine: { onZero: true }, |
| data: timeData, |
| position: 'bottom', |
| axisLabel: { |
| show: true, |
| showMaxLabel: true, |
| showMinLabel: true, |
| formatter: function (value, index) { |
| var date = new Date(value) |
| |
| |
| |
| |
| if (date.getHours() === 0 && date.getMinutes() === 0) { |
| |
| return date.getDate() |
| } else { |
| const hours = date.getHours().toString().padStart(2, '0') |
| const minutes = date.getMinutes().toString().padStart(2, '0') |
| return `${hours}:${minutes}` |
| } |
| } |
| }, |
| } |
| ], |
| yAxis: [ |
| { |
| name: 'SOC(100%)', |
| type: 'value', |
| min: 0, |
| max: 100 |
| }, |
| { |
| gridIndex: 1, |
| name: '功率(kW)', |
| type: 'value', |
| |
| } |
| ], |
| series: |
| [ |
| ...socSeries, |
| { |
| name: '功率(kW)', |
| type: 'line', |
| symbol: 'none', |
| step: 'start', |
| xAxisIndex: 1, |
| showSymbol: false, |
| yAxisIndex: 1, |
| itemStyle: { |
| color: 'rgb(255,220,97)' |
| }, |
| areaStyle: { |
| color: new echarts.graphic.LinearGradient(0, 0, 0, 1, [ |
| { |
| offset: 0, |
| color: 'rgb(255,220,97)' |
| }, |
| { |
| offset: 1, |
| color: 'rgb(247,249,255)' |
| } |
| ]) |
| }, |
| data: power |
| }, |
| { |
| name: '策略', |
| type: 'line', |
| step: 'start', |
| xAxisIndex: 1, |
| showSymbol: false, |
| yAxisIndex: 1, |
| itemStyle: { |
| color: '#2AA523' |
| }, |
| lineStyle: { |
| color: '#2AA523', |
| width: 2, |
| type: 'dashed' |
| }, |
| data: strategy |
| } |
| ] |
| option && myChart.setOption(option) |
| window.addEventListener('resize', () => { |
| myChart.resize() |
| }) |
| }, |


