为什么要去封装echarts?
| 在我们的项目中,有很多的地方都使用了echarts图表展示数据。 |
| 在有些场景,一个页面有十多个的echarts图。 |
| 这些echarts只是展示的指标不一样。 |
| 如果我们每一个echarts图都写一份配置型的话, |
| 会有非常多的冗余代码,并且如果需要某一个配置项。 |
| 我们需要给一个图修改一次,这样不仅麻烦,还恶心。 |
| 为了方便后面的维护,我们决定将echarts做一个简单实用的封装 |
我们将实现以下这些功能
| 1.父组件只需要传递X轴和Y轴的数据。 |
| 2.如果无数据的话,将展示暂无数据。 |
| 3.在渲染之前清空当前实例(会移除实例中所有的组件和图表) |
| 4.子组件用watch监听数据变化达到数据变化后立刻跟新视图 |
| 5.给一个页面可以单独配置echarts的各个属性 |
| 6.可以设置多条折线图 |
| 7.根据屏幕大小自动排列一行显示多少个图 |
| 8.echarts随屏幕大小自动进行缩放 |
| 由于echarts的类型很多,我们这里只对折线图进行封装 |
| 其他类型的图,我们可以按照这个思路来就行。 |
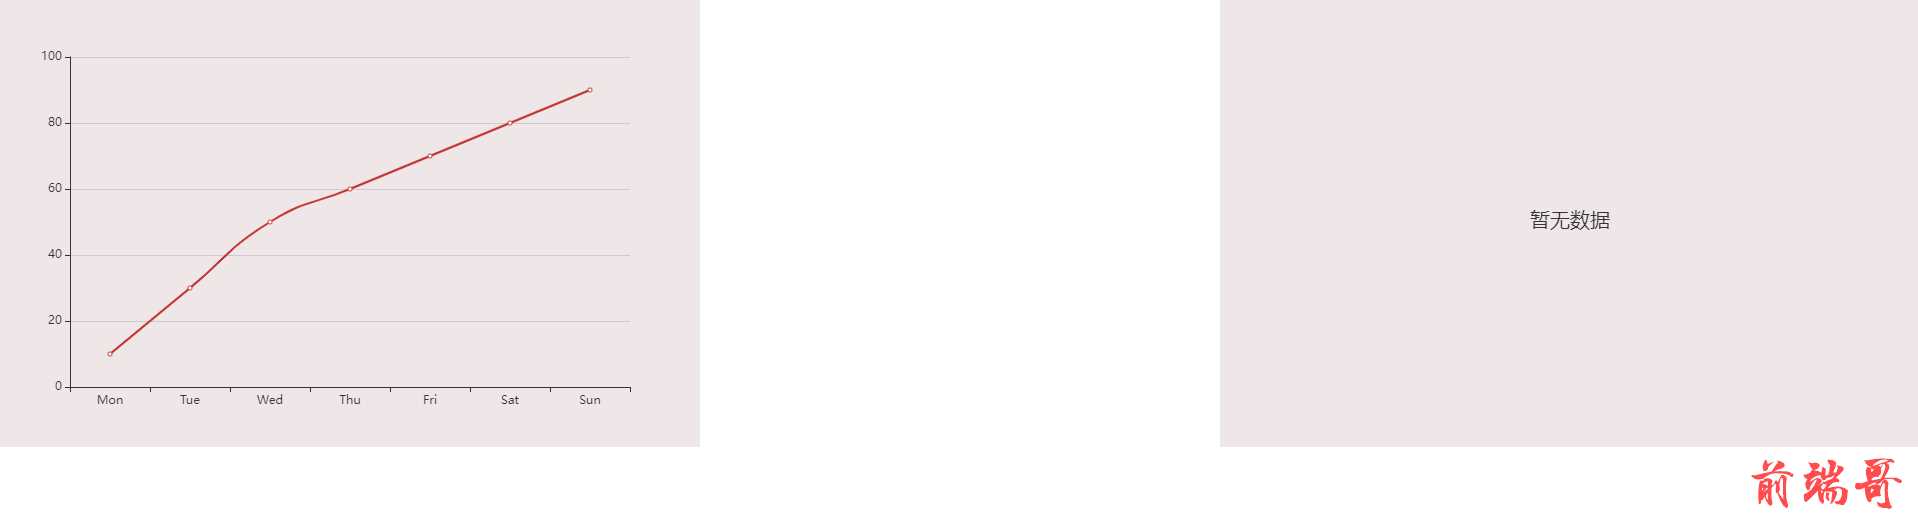
父组件传递X轴和Y轴数据以及自动显示暂无数据
| 1.父组件通过 echartsData 进行传递echarts各个坐标的数据。 |
| 2.this.echartsData.Xdata 来判断是否显示暂无数据 |
| 3.通过ref来获取dom节点。为什么不使用 id来获取echarts呢? |
| 因为id重复的话将会导致echarts无法渲染。 |
| <template> |
| <div> |
| <div class="box"> |
| <echartsLine v-for="(item,index) in listArr" |
| :echartsData="item" :key="index"></echartsLine> |
| </div> |
| </div> |
| </template> |
| <script> |
| import echartsLine from "@/components/echarts/echarts-line.vue" |
| export default { |
| data() { |
| return { |
| |
| listArr: [ |
| { |
| Xdata: ['Mon', 'Tue', 'Wed', 'Thu', 'Fri', 'Sat', 'Sun'], |
| Ydata: [10, 30, 50, 60, 70, 80, 90], |
| }, |
| { |
| Xdata: [], |
| Ydata: [], |
| } |
| ] |
| } |
| }, |
| components: { |
| echartsLine |
| } |
| } |
| </script> |
子组件
| <template> |
| <div> |
| <div class="chart" ref="demo"></div> |
| </div> |
| </template> |
| <script> |
| import echarts from 'echarts' |
| export default { |
| props: { |
| echartsData: { |
| type: Object, |
| default: () => { |
| return { |
| Xdata:[], |
| Ydata: [], |
| } |
| } |
| } |
| }, |
| data() { |
| return { |
| |
| char: null |
| } |
| }, |
| mounted() { |
| this.showEcharts() |
| }, |
| methods:{ |
| showEcharts(){ |
| |
| let demo = this.$refs.demo |
| |
| this.char = echarts.init(demo); |
| |
| this.char.clear() |
| let option = {} |
| |
| if (this.echartsData.Xdata && this.echartsData.Xdata.length == 0) { |
| option = { |
| title: { |
| text: '暂无数据', |
| x: 'center', |
| y: 'center', |
| textStyle: { |
| fontSize: 20, |
| fontWeight: 'normal', |
| } |
| } |
| } |
| } else { |
| option = { |
| xAxis: { |
| type: 'category', |
| data: this.echartsData.Xdata |
| }, |
| yAxis: { |
| type: 'value' |
| }, |
| series: [ |
| { |
| data: this.echartsData.Ydata, |
| type: 'line', |
| smooth: true |
| } |
| ] |
| }; |
| } |
| this.char.setOption(option); |
| } |
| } |
| } |
| </script> |
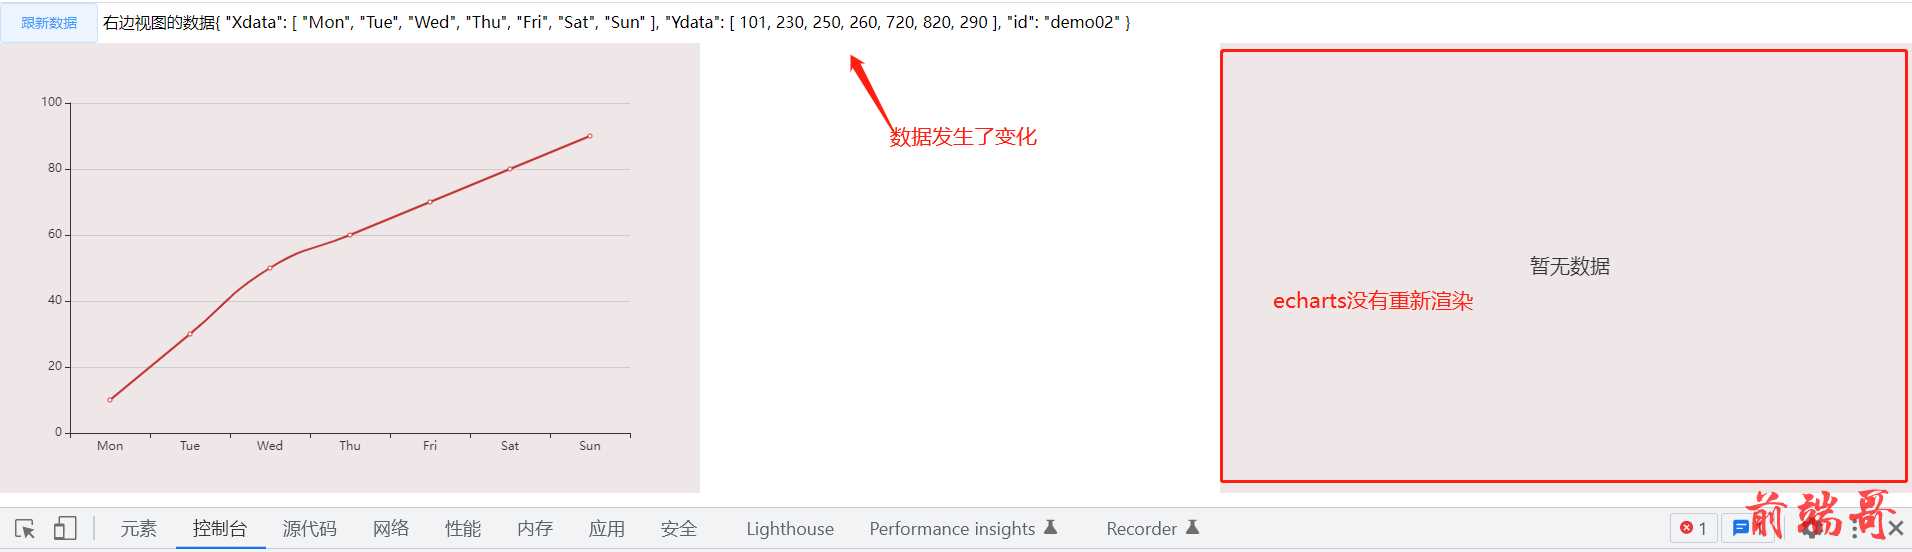
props中的数据更新后为什么视图没有重新渲染?
| 如果按照上面这样的写法,我们新增一个点击按钮跟新数据,。 |
| echarts图表是不会变化的。 |
| 因为在子组件中渲染是在mounted中被触发的,一个图表只会触发一次。 |
| 即使后面我们更新了数据,子组件中的 mounted 不会被执行。 |
| 所以不会在重新更新视图。 |
| 我们可以使用wachtch来解决这个问题 |
watch来解决数据变化后视图立即更新
| <!-- 父组件更新数据updateHandler --> |
| <template> |
| <div> |
| <el-button @click="updateHandler">跟新数据</el-button> |
| <div class="box"> |
| <echartsLine v-for="(item,index) in listArr" |
| :echartsData="item" :key="index"> |
| </echartsLine> |
| </div> |
| </div> |
| </template> |
| |
| data() { |
| return { |
| listArr: [ |
| { |
| Xdata: ['Mon', 'Tue', 'Wed', 'Thu', 'Fri', 'Sat', 'Sun'], |
| Ydata: [10, 30, 50, 60, 70, 80, 90], |
| id:'demo01' |
| }, |
| { |
| Xdata: [], |
| Ydata: [], |
| id: 'demo02' |
| } |
| ] |
| } |
| }, |
| methods: { |
| updateHandler() { |
| this.listArr[1].Xdata=['Mon', 'Tue', 'Wed', 'Thu', 'Fri', 'Sat', 'Sun'] |
| this.listArr[1].Ydata = [101, 230, 250, 260, 720, 820, 290] |
| } |
| } |
| <!-- 子组件使用watch进行监听 关键代码--> |
| mounted() { |
| this.showEcharts() |
| }, |
| methods:{ |
| showEcharts(){ |
| |
| } |
| }, |
| watch: { |
| |
| |
| |
| echartsData: { |
| handler(newVal, oldVal) { |
| this.showEcharts() |
| }, |
| |
| deep: true, |
| } |
| }, |
每个页面可以单独配置echarts的各个属性
| 按照我们目前的写法,父页面无法对echarts图表进行配置。 |
| 因为我们子组件中的配置项写死了。 |
| 为了是组件更加的灵活,我们需要对子组件中的配置项进行修改。 |
| 让它可以接收父页面中的配置项哈,我们将使用 Object.assign 将它实现 |
| |
| updateHandler() { |
| this.listArr[1].Xdata = ['Mon', 'Tue', 'Wed', 'Thu', 'Fri', 'Sat', 'Sun'] |
| this.listArr[1].Ydata = [101, 230, 250, 260, 720, 820, 290] |
| |
| this.listArr[1]['setOptionObj'] = { |
| yAxis: [{ |
| type: 'value', |
| show: false, |
| }] |
| } |
| } |
| |
| props: { |
| echartsData: { |
| type: Object, |
| default: function() { |
| return { |
| Xdata:[], |
| Ydata: [], |
| setOptionObj: { } |
| } |
| } |
| }, |
| }, |
| |
| option = { |
| xAxis: { |
| type: 'category', |
| data: this.echartsData.Xdata |
| }, |
| yAxis: { |
| type: 'value' |
| }, |
| series: [ |
| { |
| data: this.echartsData.Ydata, |
| type: 'line', |
| smooth: true |
| } |
| ] |
| }; |
| |
| |
| option= Object.assign(option, this.echartsData.setOptionObj) |
| |
| this.char.setOption(option); |
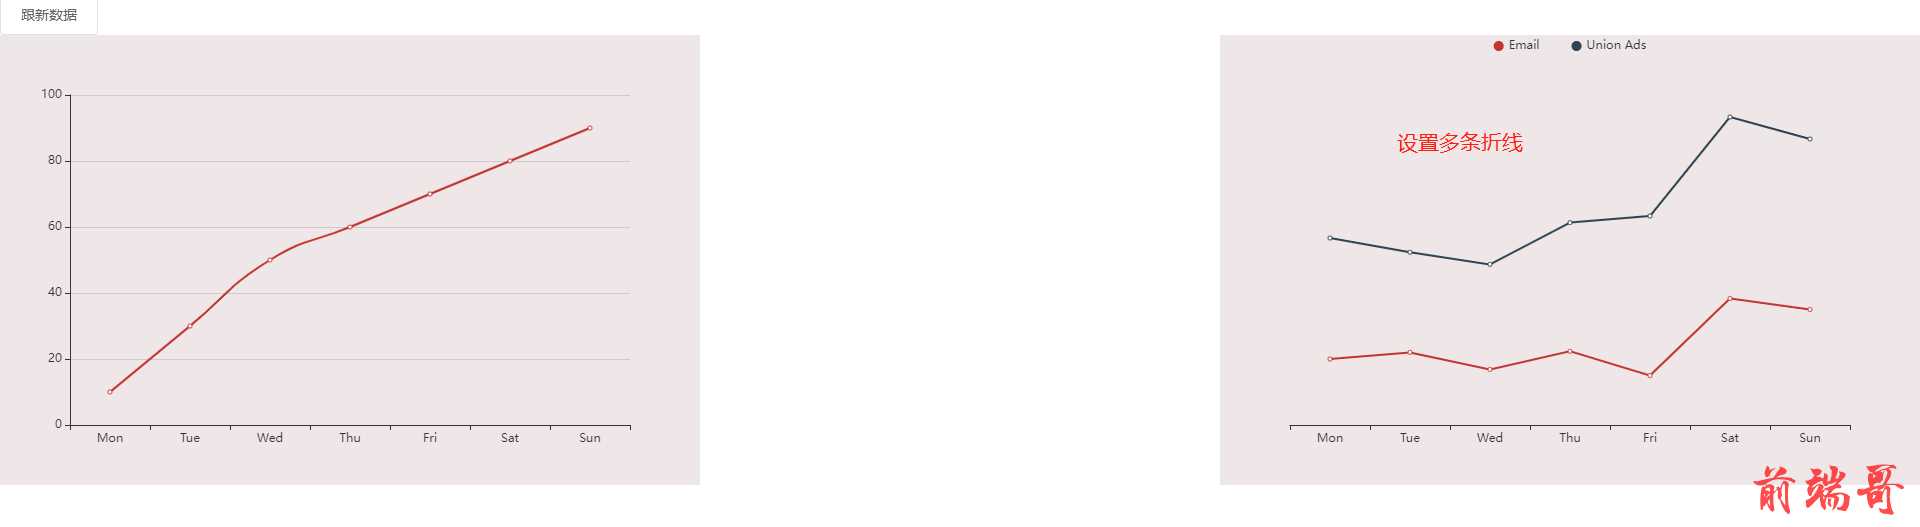
可以设置多条折线图
| 按照我们目前的代码,是无法设置多条折线的。 |
| 多条折线 series 中有多条数据,单条只有一条 |
| 单条折线的 series: [{ |
| data: [820, 932, 901, 934, 1290, 1330, 1320], |
| type: 'line', |
| smooth: true |
| }] |
| 多条折线 series: [{ |
| name: 'Email', |
| type: 'line', |
| stack: 'Total', |
| data: [120, 132, 101, 134, 90, 230, 210] |
| }, |
| { |
| name: 'Union Ads', |
| type: 'line', |
| stack: 'Total', |
| data: [220, 182, 191, 234, 290, 330, 310] |
| }] |
| 所以我们只要判断是否有series字段,如果有说明是多条折线。 |
| 否者就是单条折线 |
| 优化一下子组件中的代码 |
| |
| updateHandler() { |
| this.listArr[1].Xdata = ['Mon', 'Tue', 'Wed', 'Thu', 'Fri', 'Sat', 'Sun'] |
| this.listArr[1].Ydata = [101, 230, 250, 260, 720, 820, 290] |
| this.listArr[1]['setOptionObj'] = { |
| yAxis: [{ |
| type: 'value', |
| show: false, |
| }] |
| } |
| |
| this.listArr[1]['series'] = { |
| data: [{ |
| name: 'Email', |
| type: 'line', |
| stack: 'Total', |
| data: [120, 132, 101, 134, 90, 230, 210] |
| }, |
| { |
| name: 'Union Ads', |
| type: 'line', |
| stack: 'Total', |
| data: [220, 182, 191, 234, 290, 330, 310] |
| }] |
| } |
| } |
| |
| |
| option = { |
| xAxis: { |
| type: 'category', |
| data: this.echartsData.Xdata |
| }, |
| yAxis: { |
| type: 'value' |
| }, |
| series: [] |
| }; |
| |
| if (this.echartsData.series |
| && this.echartsData.series.data |
| && this.echartsData.series.data.length){ |
| let legendArr =[] |
| for (let i = 0; i < this.echartsData.series.data.length; i++){ |
| option.series.push(this.echartsData.series.data[i]) |
| legendArr.push(this.echartsData.series.data[i].name) |
| } |
| |
| option.legend = { |
| x: 'center', |
| data: legendArr, |
| icon: "circle", |
| itemWidth: 10, |
| itemHeight: 10, |
| itemGap: 32 |
| } |
| } else { |
| |
| option.series.push({ |
| data: this.echartsData.Ydata, |
| type: 'line', |
| smooth: true |
| }) |
| } |
| |
| option= Object.assign(option, this.echartsData.setOptionObj) |
| } |
| this.chart.setOption(option); |
根据屏幕大小自动排列一行显示多少个图
| 由于用户的设备不同,有大有小。 |
| 所以我们需要对一行显示多少个进行自动调整。 |
| 我们将使用 el-row 和 el-col 来实现 |
| 我们会获取用户的屏幕大小。 |
| 然后控制 el-col中的 span 的大小来决定一行显示多少个 |
| <el-row :gutter="20" class="el-row-box"> |
| <el-col class="el-col-m" :span="gutterNum" |
| v-for="(item, index) in listArr" :key="index"> |
| <div class="grid-content bg-purple"> |
| <echartsLine :echartsData="item" ></echartsLine> |
| </div> |
| </el-col> |
| </el-row> |
| |
| gutterNum:8, |
| |
| created() { |
| |
| |
| |
| this.getClientWidth() |
| }, |
| |
| mounted(){ |
| window.addEventListener('resize', this.getClientWidth) |
| }, |
| beforeDestroy(){ |
| window.removeEventListener('resize', this.getClientWidth) |
| }, |
| methods: { |
| getClientWidth() { |
| |
| let clientW = document.body.clientWidth; |
| console.log('clientW', clientW) |
| if (clientW >= 1680) { |
| this.gutterNum = 8 |
| } else if(clientW >= 1200){ |
| this.gutterNum = 12 |
| } else if(clientW < 1200){ |
| this.gutterNum = 24 |
| } |
| }, |
| } |

echarts随屏幕大小自动进行缩放
| 我们将会使用echarts提供的 resize 方法来进行缩放屏幕的大小。 |
| 在mounted注册监听屏幕大小变化的事件,然后调用 resize |
| data() { |
| return { |
| char: null |
| } |
| }, |
| |
| mounted() { |
| console.log('有几个echarts图,mounted函数就会被执行几次') |
| this.showEcharts() |
| window.addEventListener('resize', this.changeSize) |
| }, |
| beforeDestroy() { |
| console.log('有几个echarts图,beforeDestroy函数就会被执行几次') |
| window.removeEventListener('resize', this.changeSize) |
| }, |
| methods: { |
| changeSize() { |
| console.log('这里有可能是undefined为啥还可以正常缩放echarts', this.chart) |
| this.char && this.char.resize() |
| } |
| } |
总结
| 1. 使用watch去监听props中的对象,不能这样写 |
| watch: { |
| |
| echartsData: function (newValue,oldValue) { |
| console.log('newValue', newValue); |
| console.log('oldValue', oldValue); |
| }, |
| deep: true, |
| } |
| 上面这样去监听对象将无法触发。上面这样的只能够监听基本数据类型 |
| 我们应该改写为: |
| watch: { |
| echartsData: { |
| handler() { |
| this.showEcharts() |
| }, |
| deep: true, |
| } |
| } |
| |
| 2.子组件中 mounted 将会被多次渲染。 |
| 它的渲染次数取决于父页面中需要显示多少个echarts图。 |
| 这也是为什么echarts不会渲染出错(A指标中数据不会被渲染到C指标中) |
| 同理,由于子组件中mounted 将会被多次渲染,它会给每一个echarts注册上缩放事件(resize) |
| 离开的页面的时候,beforeDestro也将会被多次触发,依次移除监听事件 |
| |
| 3.获取文档中页面的大小可以放在created。 |
| 以前看见其他小伙伴document.body.clientWidth 是写在 mounted 中的。 |
| 不过获取节点只能写在 mounted 中 |
| |
| 4.小伙伴可能发现了,this.char 也就是echarts的实例是undefined。 |
| 也可以正常的缩放成功呢? |
| 这个问题我们下次可以讲一下。 |
| 各位大佬,麻烦点个赞,收藏,评论 |
全部代码
父页面
| <template> |
| <div class="page-echarts"> |
| <el-button @click="updateHandler">跟新数据</el-button> |
| <el-row :gutter="20" class="el-row-box"> |
| <el-col class="el-col-m" :span="gutterNum" v-for="(item, index) in listArr" :key="index"> |
| <div class="grid-content bg-purple"> |
| <echartsLine :echartsData="item" ></echartsLine> |
| </div> |
| </el-col> |
| </el-row> |
| </div> |
| </template> |
| <script> |
| import echartsLine from "@/components/echarts/echarts-line.vue" |
| export default { |
| components: { |
| echartsLine |
| }, |
| data() { |
| return { |
| gutterNum:8, |
| listArr: [ |
| { |
| Xdata: ['Mon', 'Tue', 'Wed', 'Thu', 'Fri', 'Sat', 'Sun'], |
| Ydata: [10, 30, 50, 60, 70, 80, 90], |
| id:'demo01' |
| }, |
| { |
| Xdata: [], |
| Ydata: [], |
| id: 'demo02', |
| }, |
| { |
| Xdata: [], |
| Ydata: [], |
| id: 'demo03', |
| }, |
| ] |
| } |
| }, |
| created() { |
| |
| |
| |
| this.getClientWidth() |
| }, |
| mounted() { |
| |
| window.addEventListener('resize', this.getClientWidth) |
| }, |
| beforeDestroy(){ |
| window.removeEventListener('resize', this.getClientWidth) |
| }, |
| methods: { |
| getClientWidth() { |
| |
| let clientW = document.body.clientWidth; |
| console.log('clientW', clientW) |
| if (clientW >= 1680) { |
| this.gutterNum = 8 |
| } else if(clientW >= 1200){ |
| this.gutterNum = 12 |
| } else if(clientW < 1200){ |
| this.gutterNum = 24 |
| } |
| }, |
| updateHandler() { |
| this.listArr[1].Xdata = ['Mon', 'Tue', 'Wed', 'Thu', 'Fri', 'Sat', 'Sun'] |
| this.listArr[1].Ydata = [101, 230, 250, 260, 720, 820, 290] |
| this.listArr[1]['setOptionObj'] = { |
| yAxis: [{ |
| type: 'value', |
| show: false, |
| }] |
| } |
| this.listArr[1]['series'] = { |
| data: [{ |
| name: 'Email', |
| type: 'line', |
| stack: 'Total', |
| data: [120, 132, 101, 134, 90, 230, 210] |
| }, |
| { |
| name: 'Union Ads', |
| type: 'line', |
| stack: 'Total', |
| data: [220, 182, 191, 234, 290, 330, 310] |
| }] |
| } |
| } |
| } |
| } |
| </script> |
| |
| <style lang="scss" scoped> |
| // 有些是否感觉 x轴有滚动条 |
| .page-echarts{ |
| overflow: hidden; |
| } |
| .el-row-box{ |
| margin-left: 0px !important; |
| margin-right: 0px !important; |
| } |
| .el-col-m{ |
| margin-bottom: 10px; |
| } |
| </style> |
子组件
| <template> |
| <div class="echarts-box"> |
| <div :style="{ height:height}" class="chart" :id="echartsData.id" ref="demo"></div> |
| </div> |
| </template> |
| <script> |
| import echarts from 'echarts' |
| export default { |
| props: { |
| height: { |
| type: String, |
| default:'300px' |
| }, |
| echartsData: { |
| type: Object, |
| default: function() { |
| return { |
| Xdata:[], |
| Ydata: [], |
| setOptionObj: { } |
| } |
| } |
| }, |
| showData: { |
| type: String, |
| } |
| }, |
| data() { |
| return { |
| char: null |
| } |
| }, |
| mounted() { |
| console.log('有几个echarts图,mounted函数就会被执行几次') |
| this.showEcharts() |
| window.addEventListener('resize', this.changeSize) |
| }, |
| beforeDestroy() { |
| console.log('有几个echarts图,beforeDestroy函数就会被执行几次') |
| window.removeEventListener('resize', this.changeSize) |
| }, |
| watch: { |
| |
| |
| echartsData: { |
| handler() { |
| this.showEcharts() |
| }, |
| |
| deep: true, |
| } |
| }, |
| methods: { |
| changeSize() { |
| console.log('这里有可能是undefined为啥还可以正常缩放echarts', this.chart) |
| this.char && this.char.resize() |
| }, |
| showEcharts() { |
| |
| let demo=this.$refs.demo |
| |
| this.char = echarts.init(demo) |
| this.char.clear() |
| let option = {} |
| |
| if (this.echartsData.Xdata && this.echartsData.Xdata.length == 0) { |
| option = { |
| title: { |
| text: '暂无数据', |
| x: 'center', |
| y: 'center', |
| textStyle: { |
| fontSize: 20, |
| fontWeight: 'normal', |
| } |
| } |
| } |
| } else { |
| option = { |
| xAxis: { |
| type: 'category', |
| data: this.echartsData.Xdata |
| }, |
| yAxis: { |
| type: 'value' |
| }, |
| series: [] |
| }; |
| |
| if (this.echartsData.series && this.echartsData.series.data&& this.echartsData.series.data.length) { |
| let legendArr =[] |
| for (let i = 0; i < this.echartsData.series.data.length; i++){ |
| option.series.push(this.echartsData.series.data[i]) |
| legendArr.push(this.echartsData.series.data[i].name) |
| } |
| |
| option.legend = { |
| x: 'center', |
| data: legendArr, |
| icon: "circle", |
| itemWidth: 10, |
| itemHeight: 10, |
| itemGap: 32 |
| } |
| } else { |
| |
| option.series.push({ |
| data: this.echartsData.Ydata, |
| type: 'line', |
| smooth: true |
| }) |
| } |
| |
| option= Object.assign(option, this.echartsData.setOptionObj) |
| } |
| this.char.setOption(option); |
| } |
| } |
| } |
| </script> |
| |
| <style scoped> |
| .echarts-box{ |
| width: 100%; |
| height: 100%; |
| } |
| .chart { |
| background: #eee7e7; |
| } |
| </style> |


