ANTV X6 流程图编辑器应用
唠唠叨叨
| 唉!最近感觉非常忙,要学的东西太多,要实现的方法变幻莫测,层出不穷,越学越觉得自己不会的实在太多。 |
| 项目本来中标了,后来又不知道发生了什么,临到签合同又黄了,整的我们开发的瑟瑟发抖,产品整个大改,恐怕要…… |
| 只能说还是抓紧时间好好学习,知识和技术是永远不会背叛自己的。 |
| |
事发背景
| 俺滴组长(后端大佬)要我配合开发数据平台的任务流全局调度系统,想用流程图实现作业运行配置。 |
| 于是我在各种流程图的前端框架中选了ANTV X6来引入实现。官方文档天天在看,可这知识他就是不入脑子呀TvT。 |
| 终于有一天腌肉某人一拍脑门醍醐灌顶实现了功能,遂记录实现过程及困难解决方法。 |
| |

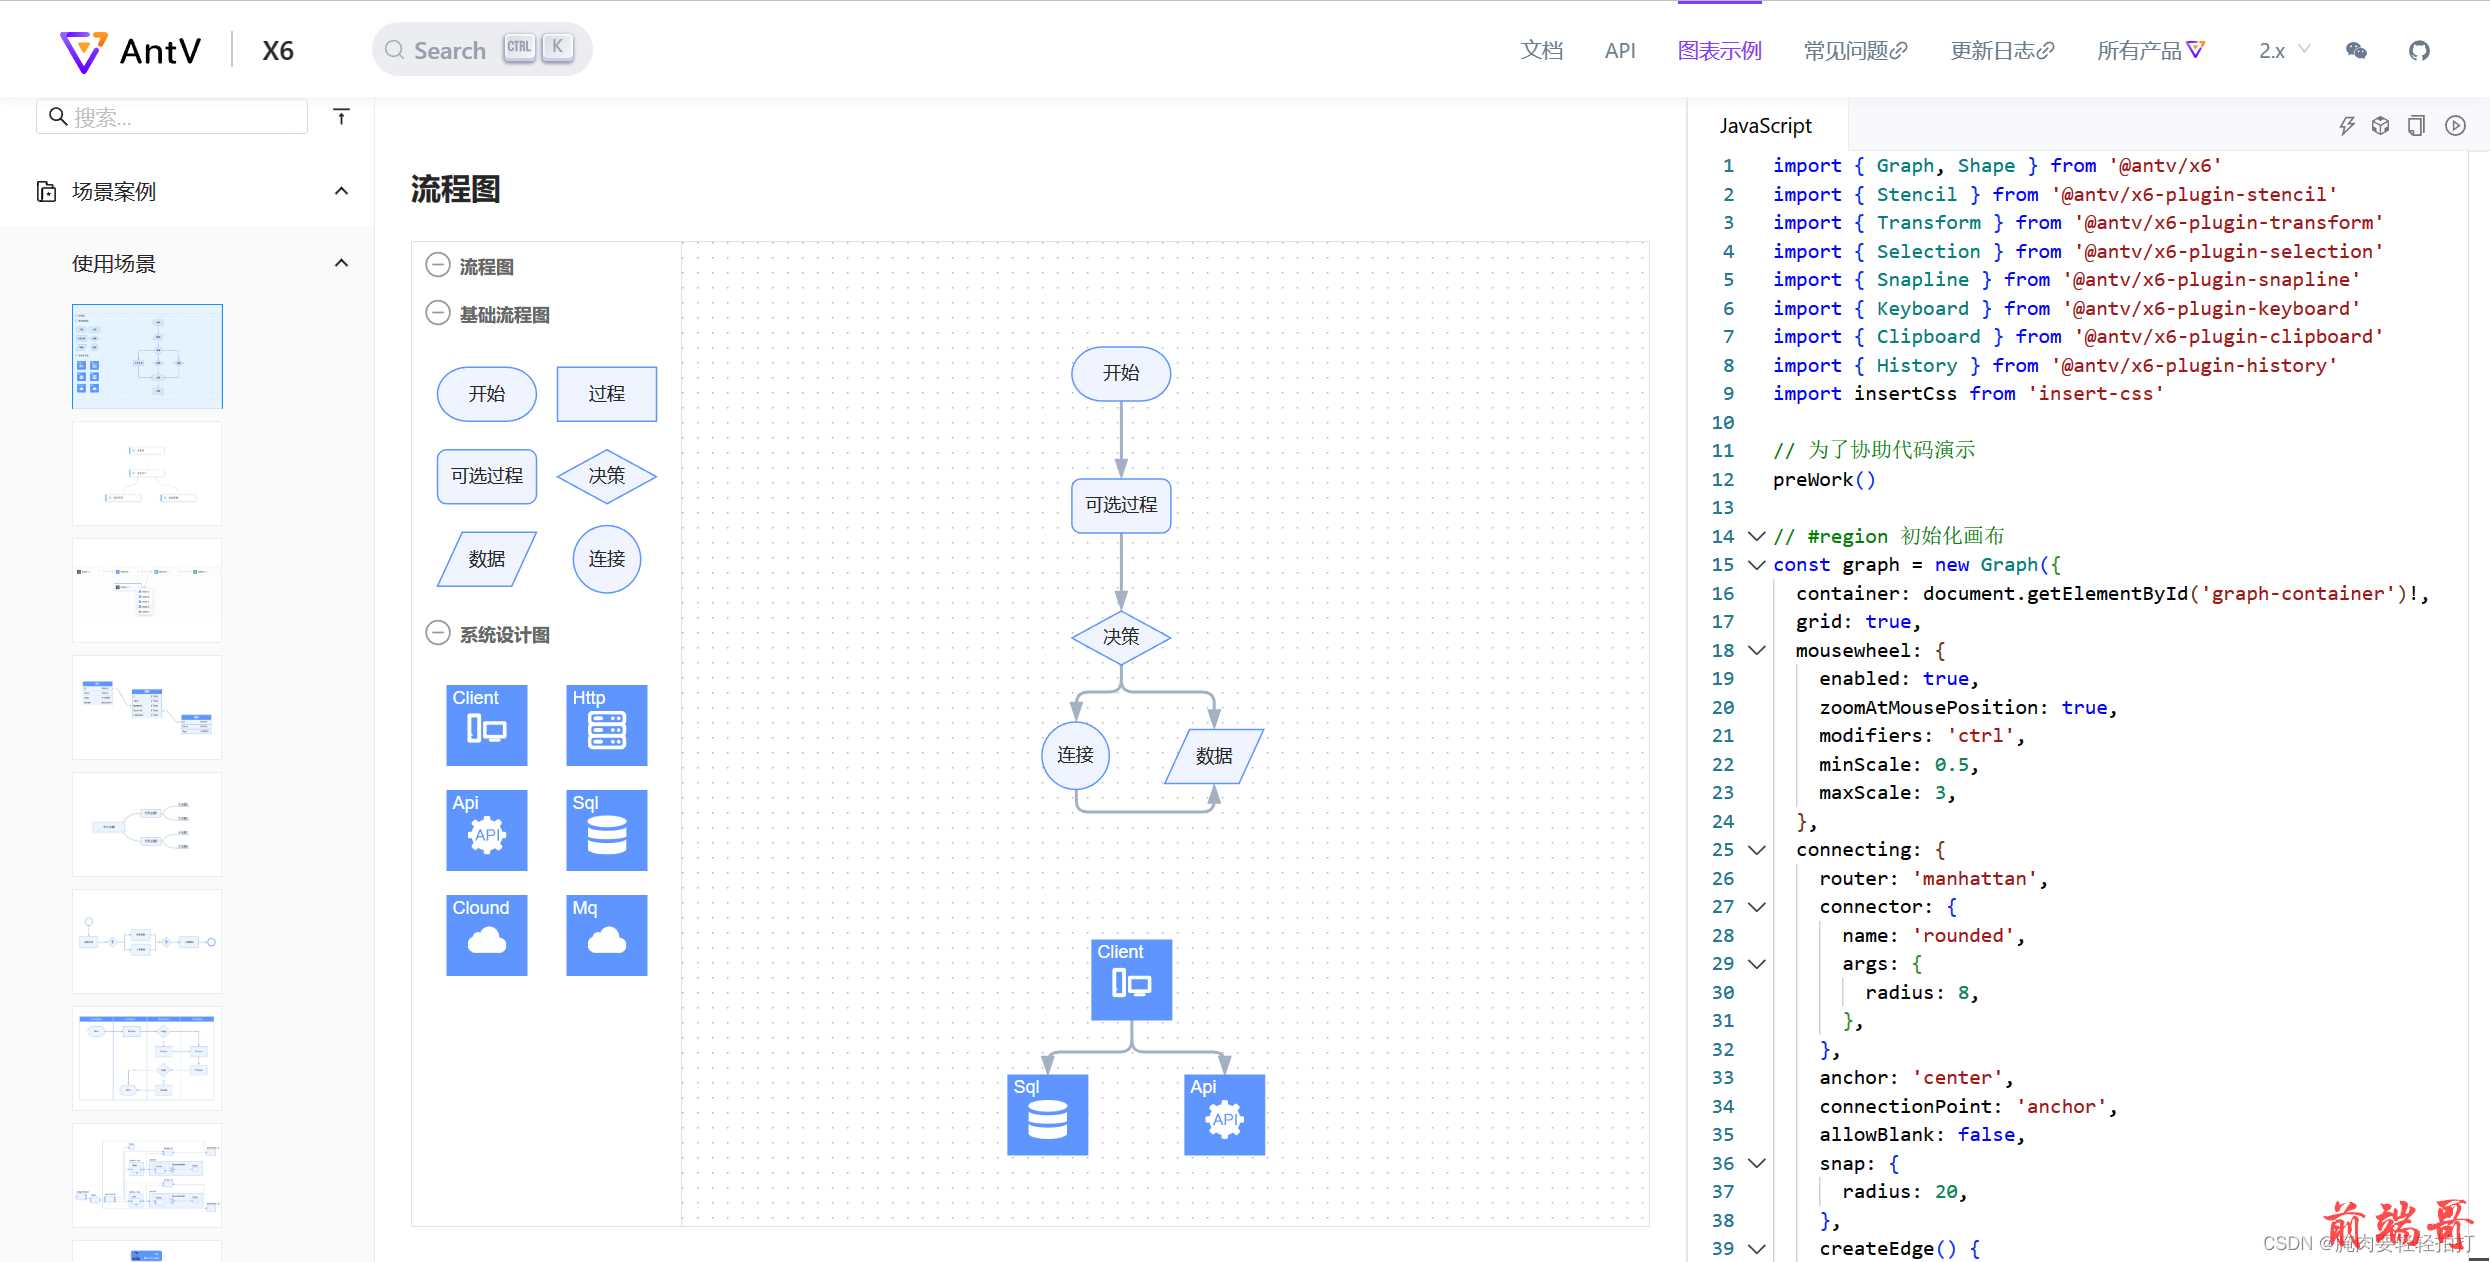
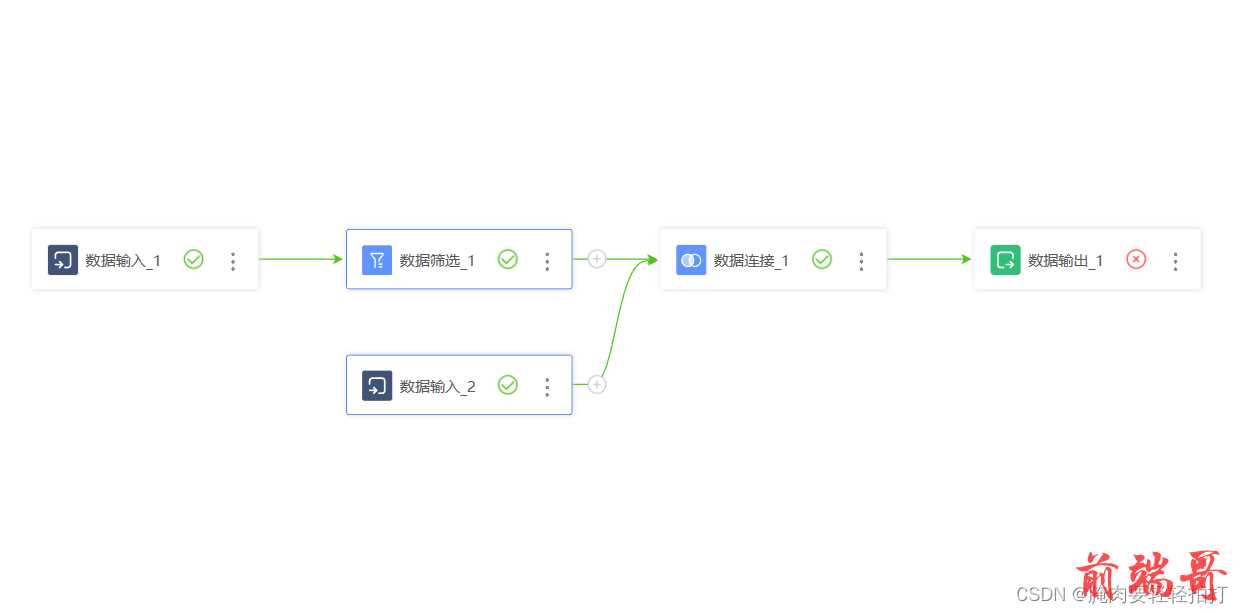
在官方文档中给出了场景案例,恰好就有我所需要的流程图:
实现效果
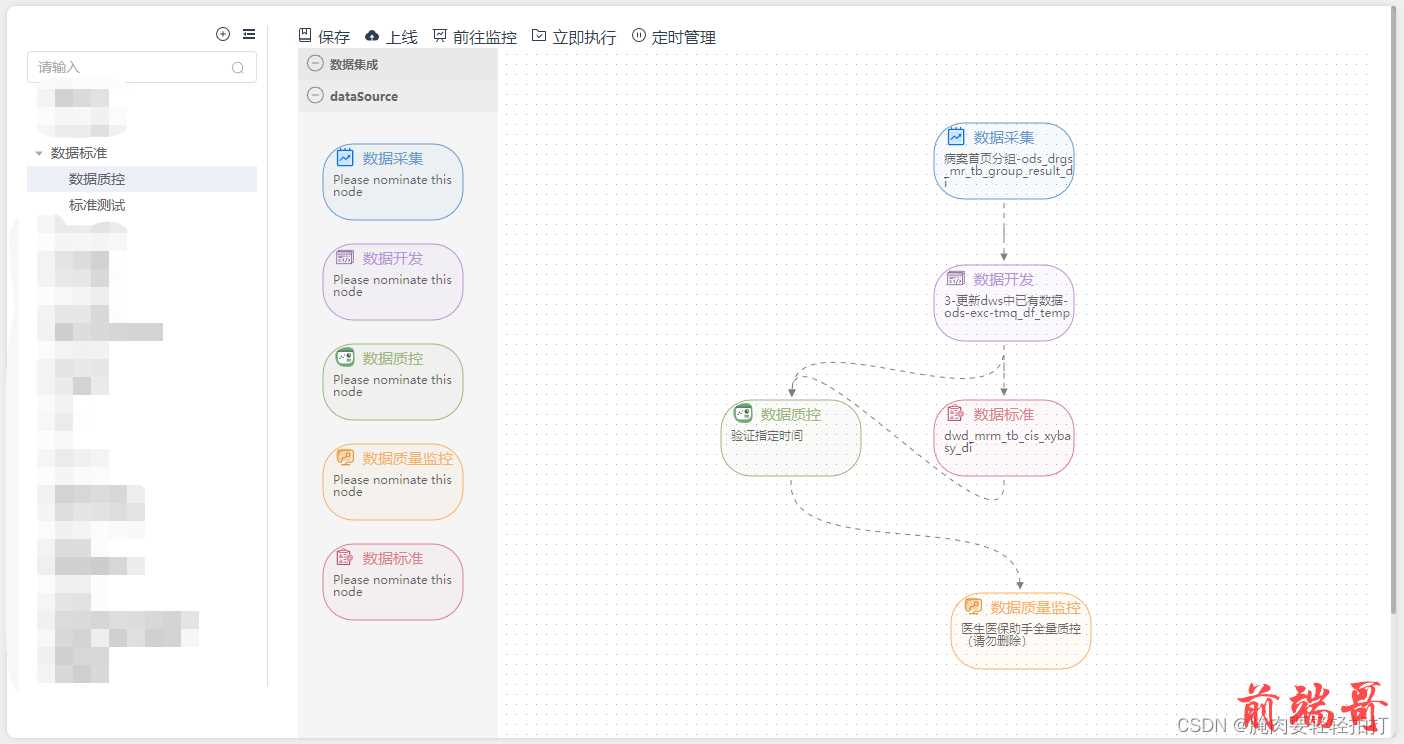
经过一系列拼拼凑凑,修修改改,还有样式设计和调整,调度作业画布页面如下图所示:
实现思路
- 首先我们要了解系统的业务功能需求,以及业务流程的线路是怎样的;
如图是窗口的拆解,其中①作业树使用的是element UI的el-tree组件,是用于储存画布内容和画布回显更新的,②是选中节点树中的某项流程作业进行对应的任务操作,③和④才是实际应用AntV X6的画布插件实现的可拖拽、增、删、改、配置的流程图编辑器。
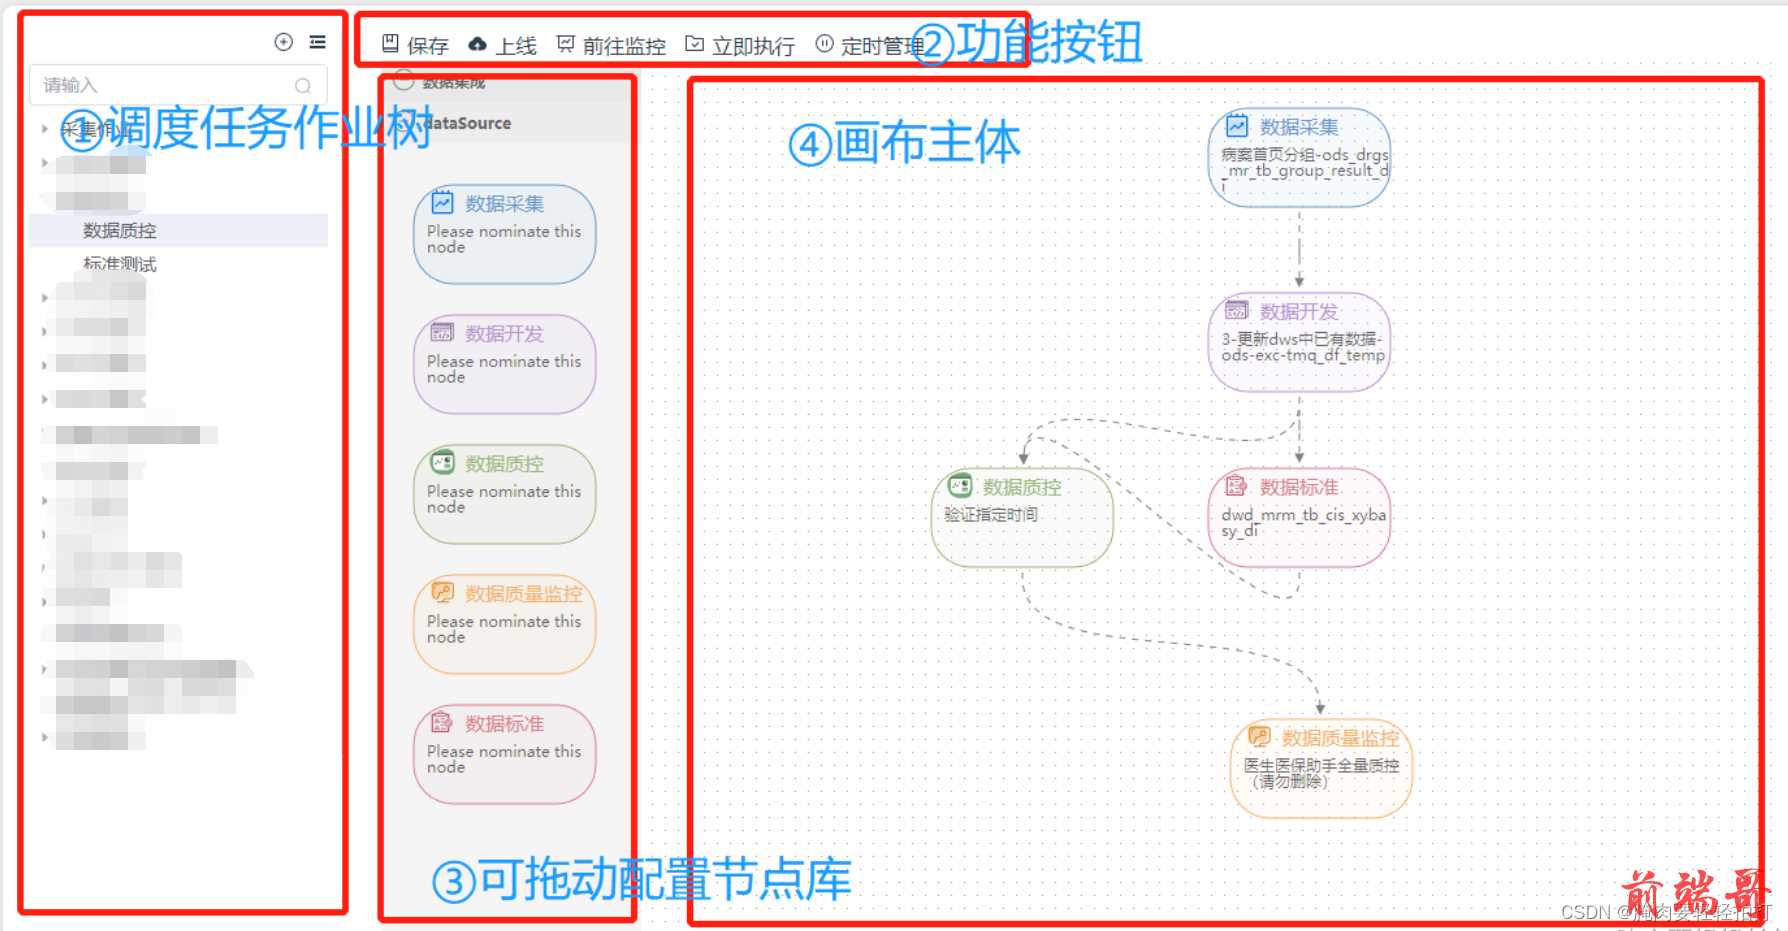
通过vue的父子组件我们创建一个index.vue的父组件,然后将这四个部分拆分为三个子组件的.vue文件,分别为DataTree.vue、DataButton.vue、FiliationGraph.vue(包含③、④两部分)今天记录的是FiliationGraph.vue内节点配置画布的实现。
2. 安装AntV X6
通过 npm 或 yarn 命令安装 X6。
| # npm |
| $ npm install @antv/x6 --save |
| |
| # yarn |
| $ yarn add @antv/x6 |
- 初始化画布,在html中建立节点库和画布div容器:
| <-- 节点库 --> |
| <div class="app-stencil" ref="stencilContainer"></div> |
| <-- 画布 --> |
| <div class="app-content" id="flowContainer" ref="container"></div> |
| // 引入 |
| import { Graph, Shape, Addon, FunctionExt } from "@antv/x6"; |
| |
| const { Stencil } = Addon; //节点库 |
| const {graph} = Graph; //画布 |
| |
| const stencil = new Stencil({ //新建节点库 |
| title: "数据集成", |
| target: graph, |
| search: false, // 搜索 |
| collapsable: true, |
| stencilGraphWidth: 300, //容器宽度 |
| stencilGraphHeight: 600, //容器长度 |
| groups: [ //分组 |
| { |
| name: "processLibrary", |
| title: "dataSource", |
| }, |
| ], |
| layoutOptions: { |
| dx: 30, |
| dy: 20, |
| columns: 1, //列数(行内节点数) |
| columnWidth: 130, //列宽 |
| rowHeight: 100, //行高 |
| }, |
| }); |
| proxy.$refs.stencilContainer.appendChild(stencil.container) //注册到div中 |
| const graph = new Graph({ // 新建画布 |
| container: document.getElementById('flowContainer'), |
| width: 800, |
| height: 600, |
| background: { |
| color: "#F2F7FA", |
| }, |
| }); |
| |
- 初始化节点、边:
初始化节点、边数据:
| const nodeData = { |
| |
| nodes: [ |
| ], |
| |
| edges: [ |
| ], |
| }; |
准备节点样式内容数据,其中节点的左上角图标image是自定义的svg文件,根据产品ui或自己设计来使用哟。
| const imageShapes = [ |
| { |
| body: { |
| fill: "rgba(102, 153, 204, 0.05)", |
| stroke: "rgb(102, 153, 204)", |
| }, |
| label: { |
| text: state.collectLabel, |
| fill: 'rgb(102, 153, 204)', |
| }, |
| image: require('/src/assets/Scheduler/DataCollect.svg'), |
| }, |
| { |
| body: { |
| fill: "rgba(185, 147, 214, 0.05)", |
| stroke: "rgb(185, 147, 214)", |
| }, |
| label: { |
| text: state.flinkLabel, |
| fill: 'rgb(185, 147, 214)', |
| }, |
| image: require('/src/assets/Scheduler/DataFlink.svg'), |
| }, |
| { |
| body: { |
| fill: "rgba(154, 184, 122, 0.05)", |
| stroke: "rgb(154, 184, 122)", |
| }, |
| label: { |
| text: state.controlLabel, |
| fill: 'rgb(154, 184, 122)', |
| }, |
| image: require('/src/assets/Scheduler/DataQc.svg'), |
| }, |
| { |
| body: { |
| fill: "rgba(247, 178, 103, 0.05)", |
| stroke: "rgb(247, 178, 103)", |
| }, |
| label: { |
| text: state.monitorLabel, |
| fill: 'rgb(247, 178, 103)', |
| }, |
| image: require('/src/assets/Scheduler/DataWatch.svg'), |
| }, |
| { |
| body: { |
| fill: "rgba(219, 127, 142, 0.05)", |
| stroke: "rgb(219, 127, 142)", |
| }, |
| label: { |
| text: state.standerLabel, |
| fill: 'rgb(219, 127, 142)', |
| }, |
| image: require('/src/assets/Scheduler/DataStandred.svg'), |
| }, |
| ] |
- 左侧模型栏节点样式:
初始化链接桩
| const ports = { |
| groups: { |
| in: { |
| position: 'top', |
| attrs: { |
| circle: { |
| r: 4, |
| magnet: true, |
| stroke: '#108ee9', |
| strokeWidth: 2, |
| fill: '#fff', |
| style: { |
| visibility: "hidden", |
| }, |
| } |
| } |
| }, |
| out: { |
| position: 'bottom', |
| attrs: { |
| circle: { |
| r: 4, |
| magnet: true, |
| stroke: '#31d0c6', |
| strokeWidth: 2, |
| fill: '#fff', |
| style: { |
| visibility: "hidden", |
| }, |
| } |
| } |
| } |
| }, |
| items: [ |
| { |
| id: state.currentCode+ '_in', |
| group: 'in', |
| }, |
| { |
| id: state.currentCode + '_out', |
| group: 'out', |
| }, |
| ], |
| } |
根据样式数据,设计画布左侧节点样式
| Graph.registerNode( |
| 'custom-node', |
| { |
| inherit: 'rect', |
| width: 140, |
| height: 76, |
| attrs: { |
| body: { |
| strokeWidth: 1, |
| rx: 30, |
| ry: 30, |
| }, |
| image: { |
| width: 20, |
| height: 20, |
| x: 12, |
| y: 3, |
| }, |
| text: { |
| refX: 40, |
| refY: 15, |
| fontSize: 15, |
| 'text-anchor': 'start', |
| }, |
| label: { |
| text: 'Please nominate this node', |
| id: 0, |
| data: {}, |
| refX: 10, |
| refY: 30, |
| fontSize: 12, |
| fill: 'rgba(0,0,0,0.6)', |
| 'text-anchor': 'start', |
| textWrap: { |
| width: -10, |
| height: '70%', |
| ellipsis: true, |
| breakWord: true, |
| } |
| }, |
| }, |
| markup: [ |
| { |
| tagName: 'rect', |
| selector: 'body', |
| }, |
| { |
| tagName: 'image', |
| selector: 'image', |
| }, |
| { |
| tagName: 'text', |
| selector: 'text', |
| }, |
| { |
| tagName: 'text', |
| selector: 'label', |
| }, |
| ], |
| data: {}, |
| relation: {}, |
| ports: { ...ports }, |
| }, |
| true, |
| ) |
| const imageNodes = imageShapes.map((item) => |
| graph.createNode({ |
| shape: 'custom-node', |
| attrs: { |
| image: { |
| 'xlink:href': item.image, |
| }, |
| body: item.body, |
| text: item.label, |
| }, |
| }), |
| ) |
| stencil.load( |
| imageNodes, |
| "processLibrary" |
| ); |
6.定义边的样式(节点连线)
| Graph.registerConnector( |
| 'algo-edge', |
| (source, target) => { |
| const offset = 4 |
| const control = 80 |
| const v1 = { x: source.x, y: source.y + offset + control } |
| const v2 = { x: target.x, y: target.y - offset - control } |
| |
| return `M ${source.x} ${source.y} |
| L ${source.x} ${source.y + offset} |
| C ${v1.x} ${v1.y} ${v2.x} ${v2.y} ${target.x} ${target.y - offset} |
| L ${target.x} ${target.y}` |
| }, |
| true, |
| ) |
以及可以在初始化画布graph = new graph({})方法中,定义连线规则
| |
| connecting: { |
| snap: true, |
| allowBlank: false, |
| allowLoop: false, |
| allowMulti: false, |
| highlight: true, |
| sourceAnchor: { |
| name: 'bottom', |
| args: { |
| dx: 0, |
| }, |
| }, |
| targetAnchor: { |
| name: 'top', |
| args: { |
| dx: 0, |
| }, |
| }, |
| connectionPoint: 'anchor', |
| connector: 'algo-edge', |
| createEdge() { |
| return graph.createEdge({ |
| attrs: { |
| line: { |
| strokeDasharray: '5 5', |
| stroke: '#808080', |
| strokeWidth: 1, |
| targetMarker: { |
| name: 'block', |
| args: { |
| size: '6', |
| }, |
| }, |
| }, |
| }, |
| }) |
| }, |
| validateMagnet({ magnet }) { |
| return magnet.getAttribute('port-group') !== 'in' |
| }, |
| validateConnection({ |
| sourceView, |
| targetView, |
| sourceMagnet, |
| targetMagnet |
| }) { |
| if (sourceView === targetView) { |
| return false; |
| } |
| if (!sourceMagnet) { |
| return false; |
| } |
| |
| if ( |
| !targetMagnet || |
| targetMagnet.getAttribute("port-group") !== "in" |
| ) { |
| return false; |
| } |
| return true; |
| }, |
| |
| validateEdge({ edge }) { |
| const { source, target } = edge |
| return true |
| } |
| }, |
7.方法们
| graph.toJSON() |
| graph.fromJSON() |
| graph.isPannable() |
| graph.enablePanning() |
| graph.centerContent(); |
8.绑定事件
| graph.on('node:added', ({ node, cell }) => {}) |
| graph.on("cell:dblclick", ({ node, cell }) => {}); |
| graph.on("node:mouseenter", ({ node }) => { |
| |
| node.addTools({ |
| name: "button-remove", |
| args: { |
| x: 0, |
| y: 0, |
| offset: { x: 10, y: 10 }, |
| markup: [ |
| { |
| tagName: 'circle', |
| selector: 'button', |
| attrs: { |
| r: 8, |
| stroke: '#F25C54', |
| strokeWidth: 1, |
| fill: 'rgba(214, 40, 40, 0.25)', |
| cursor: 'pointer', |
| }, |
| }, |
| { |
| tagName: 'text', |
| textContent: '✕', |
| selector: 'icon', |
| attrs: { |
| fill: '#F25C54', |
| fontSize: 7, |
| textAnchor: 'middle', |
| pointerEvents: 'none', |
| y: '0.3em', |
| }, |
| }, |
| ], |
| }, |
| }); |
| }); |
| graph.on("node:removed", ({ node, options }) => { |
| if (!options.ui) { |
| return; |
| } |
| }); |
| graph.on("node:mouseleave", ({ node }) => { |
| |
| node.removeTools(); |
| }); |
| |
| graph.on("edge:mouseenter", ({ edge }) => { |
| |
| edge.addTools([ |
| "target-arrowhead", |
| { |
| name: "button-remove", |
| args: { |
| distance: -30, |
| }, |
| }, |
| ]); |
| }); |
| graph.on("edge:removed", ({ edge, options }) => { |
| if (!options.ui) { |
| return; |
| } |
| const cellId = edge.getTargetCellId() |
| const target = graph.getCellById(cellId)、 |
| if (target) { |
| const id = target.ports.items[0].id |
| target && target.setPortProp(id, 'connected', false) |
| }else{ |
| target && target.setPortProp(cellId+'_in', 'connected', false) |
| } |
| }); |
| graph.on("edge:mouseleave", ({ edge }) => { |
| |
| edge.removeTools(); |
| }); |
| graph.on('node:change:data', ({ node }) => { |
| node.data = eachNodeData |
| }) |
| graph.on("node:contextmenu", ({ cell, view }) => { |
| const oldText = cell.attr("text/textWrap/text"); |
| const elem = view.container.querySelector(".x6-edit-text"); |
| if (elem == null) { |
| return; |
| } |
| cell.attr("text/style/display", "none"); |
| if (elem) { |
| elem.style.display = ""; |
| elem.contentEditable = "true"; |
| elem.innerText = oldText; |
| elem.focus(); |
| } |
| const onBlur = () => { |
| cell.attr("text/textWrap/text", elem.innerText); |
| cell.attr("text/style/display", ""); |
| elem.style.display = "none"; |
| elem.contentEditable = "false"; |
| }; |
| elem.addEventListener("blur", () => { |
| onBlur(); |
| elem.removeEventListener("blur", onBlur); |
| }); |
| }); |
| const container = document.getElementById("flowContainer"); |
| graph.on("node:mouseenter",FunctionExt.debounce(() => { |
| const ports = container.querySelectorAll(".x6-port-body"); |
| showPorts(ports, true); |
| }), |
| 500 |
| ); |
| graph.on("node:mouseleave", () => { |
| const ports = container.querySelectorAll(".x6-port-body"); |
| showPorts(ports, false); |
| }); |
| graph.bindKey("backspace", () => { |
| const cells = graph.getSelectedCells(); |
| if (cells.length) { |
| graph.removeCells(cells); |
| } |
| }); |
其他有趣的用法
| |
| cell.attr('label/text', state.flinkLabel) |
| cell.attr('label/data', j) |
9.根据接口数据回显画布流程图
总结
在vue项目中,使用AntV X6实现节点和画布、连线的配置,非常灵活,一旦会用后有相当多的方法可以使用,自由度和定制度高。还有许多用法可以实现,如点击执行指令显示流程图的动画运行流:
还有自定义的布局等

剩下的其他拓展方法等我下次整理了再发,今天这篇太长了,肝不动了TvT。
参考资料
- ANTV-X6 流程图
- ANTV-X6 快速上手


