
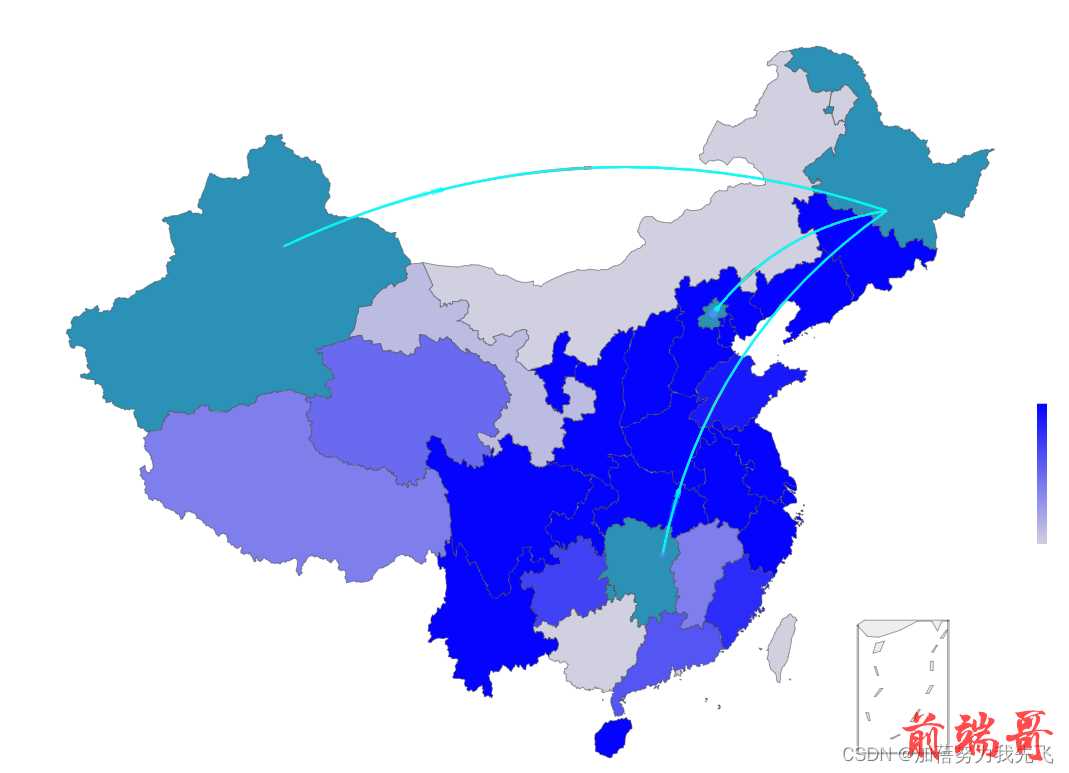
var mapData= [ { name: "北京", devicesCount: 100, //总数 value: 10, //使用个数 }, { name: "天津", devicesCount: 50, value: 20, }, { name: "上海", devicesCount: 80, value: 30, }, { name: "重庆", devicesCount: 90, value: 40, }, { name: "河北", devicesCount: 130, value: 50, }, { name: "河南", devicesCount: 160, value: 80, }, { name: "云南", devicesCount: 110, value: 40, }, { name: "辽宁", devicesCount: 320, value: 120, }, { name: "黑龙江", devicesCount: 80, value: 40, }, { name: "湖南", devicesCount: 60, value: 10, }, { name: "安徽", devicesCount: 300, value: 270, }, { name: "山东", devicesCount: 50, value: 9, }, { name: "新疆", devicesCount: 40, value: 0, }, { name: "江苏", devicesCount: 240, value: 40, }, { name: "浙江", devicesCount: 450, value: 300, }, { name: "江西", devicesCount: 20, value: 4, }, { name: "湖北", devicesCount: 50, value: 40, }, { name: "广西", devicesCount: 10, value: 0, }, { name: "甘肃", devicesCount: 20, value: 1, }, { name: "山西", devicesCount: 230, value: 140, }, { name: "内蒙古", devicesCount: 200, value: 0, }, { name: "陕西", devicesCount: 30, value: 40, }, { name: "吉林", devicesCount: 77, value: 40, }, { name: "福建", devicesCount: 55, value: 8, }, { name: "贵州", devicesCount: 55, value: 7, }, { name: "广东", devicesCount: 44, value: 6, }, { name: "青海", devicesCount: 33, value: 5, }, { name: "西藏", devicesCount: 10, value: 4, }, { name: "四川", devicesCount: 99, value: 20, }, { name: "宁夏", devicesCount: 145, value: 40, }, { name: "海南", devicesCount: 122, value: 90, }, { name: "台湾", devicesCount: 10, value: 0, }, { name: "香港", devicesCount: 0, value: 0, }, { name: "澳门", devicesCount: 0, value: 0, }, ] var mapData1=[ { name: "黑龙江", devicesCount: 80, value: 40, selected: true,//默认高亮 //定义默认选中-的高亮颜色 emphasis: { itemStyle: { areaColor: "#8dcfa3", }, }, }, { name: "新疆", devicesCount: 40, value: 0, selected: true,//默认高亮 //定义默认选中-的高亮颜色 emphasis: { itemStyle: { areaColor: "#2b91b7", }, }, }, { name: "湖南", devicesCount: 60, value: 10, selected: true,//默认高亮 //定义默认选中-的高亮颜色 emphasis: { itemStyle: { areaColor: "#2b91b7", }, }, }, { name: "北京", devicesCount: 100, //总数 value: 10, //使用个数 selected: true,//默认高亮 //定义默认选中-的高亮颜色 emphasis: { itemStyle: { areaColor: "#2b91b7", }, }, }, ] var geoCoordMap1 = { 上海: [121.4648, 31.2891], 东莞: [113.8953, 22.901], 东营: [118.7073, 37.5513], 中山: [113.4229, 22.478], 临汾: [111.4783, 36.1615], 临沂: [118.3118, 35.2936], 丹东: [124.541, 40.4242], 丽水: [119.5642, 28.1854], 乌鲁木齐: [87.9236, 43.5883], 佛山: [112.8955, 23.1097], 保定: [115.0488, 39.0948], 兰州: [103.5901, 36.3043], 包头: [110.3467, 41.4899], 北京: [116.4551, 40.2539], 北海: [109.314, 21.6211], 南京: [118.8062, 31.9208], 南宁: [108.479, 23.1152], 南昌: [116.0046, 28.6633], 南通: [121.1023, 32.1625], 厦门: [118.1689, 24.6478], 台州: [121.1353, 28.6688], 合肥: [117.29, 32.0581], 呼和浩特: [111.4124, 40.4901], 咸阳: [108.4131, 34.8706], 哈尔滨: [127.9688, 45.368], 唐山: [118.4766, 39.6826], 嘉兴: [120.9155, 30.6354], 大同: [113.7854, 39.8035], 大连: [122.2229, 39.4409], 天津: [117.4219, 39.4189], 太原: [112.3352, 37.9413], 威海: [121.9482, 37.1393], 宁波: [121.5967, 29.6466], 宝鸡: [107.1826, 34.3433], 宿迁: [118.5535, 33.7775], 常州: [119.4543, 31.5582], 广州: [113.5107, 23.2196], 廊坊: [116.521, 39.0509], 延安: [109.1052, 36.4252], 张家口: [115.1477, 40.8527], 徐州: [117.5208, 34.3268], 德州: [116.6858, 37.2107], 惠州: [114.6204, 23.1647], 成都: [103.9526, 30.7617], 扬州: [119.4653, 32.8162], 承德: [117.5757, 41.4075], 拉萨: [91.1865, 30.1465], 无锡: [120.3442, 31.5527], 日照: [119.2786, 35.5023], 昆明: [102.9199, 25.4663], 杭州: [119.5313, 29.8773], 枣庄: [117.323, 34.8926], 柳州: [109.3799, 24.9774], 株洲: [113.5327, 27.0319], 武汉: [114.3896, 30.6628], 汕头: [117.1692, 23.3405], 江门: [112.6318, 22.1484], 沈阳: [123.1238, 42.1216], 沧州: [116.8286, 38.2104], 河源: [114.917, 23.9722], 泉州: [118.3228, 25.1147], 泰安: [117.0264, 36.0516], 泰州: [120.0586, 32.5525], 济南: [117.1582, 36.8701], 济宁: [116.8286, 35.3375], 海口: [110.3893, 19.8516], 淄博: [118.0371, 36.6064], 淮安: [118.927, 33.4039], 深圳: [114.5435, 22.5439], 清远: [112.9175, 24.3292], 温州: [120.498, 27.8119], 渭南: [109.7864, 35.0299], 湖州: [119.8608, 30.7782], 湘潭: [112.5439, 27.7075], 滨州: [117.8174, 37.4963], 潍坊: [119.0918, 36.524], 烟台: [120.7397, 37.5128], 玉溪: [101.9312, 23.8898], 珠海: [113.7305, 22.1155], 盐城: [120.2234, 33.5577], 盘锦: [121.9482, 41.0449], 石家庄: [114.4995, 38.1006], 福州: [119.4543, 25.9222], 秦皇岛: [119.2126, 40.0232], 绍兴: [120.564, 29.7565], 聊城: [115.9167, 36.4032], 肇庆: [112.1265, 23.5822], 舟山: [122.2559, 30.2234], 苏州: [120.6519, 31.3989], 莱芜: [117.6526, 36.2714], 菏泽: [115.6201, 35.2057], 营口: [122.4316, 40.4297], 葫芦岛: [120.1575, 40.578], 衡水: [115.8838, 37.7161], 衢州: [118.6853, 28.8666], 西宁: [101.4038, 36.8207], 西安: [109.1162, 34.2004], 贵阳: [106.6992, 26.7682], 连云港: [119.1248, 34.552], 邢台: [114.8071, 37.2821], 邯郸: [114.4775, 36.535], 郑州: [113.4668, 34.6234], 鄂尔多斯: [108.9734, 39.2487], 重庆: [107.7539, 30.1904], 金华: [120.0037, 29.1028], 铜川: [109.0393, 35.1947], 银川: [106.3586, 38.1775], 镇江: [119.4763, 31.9702], 长春: [125.8154, 44.2584], 长沙: [113.0823, 28.2568], 长治: [112.8625, 36.4746], 阳泉: [113.4778, 38.0951], 青岛: [120.4651, 36.3373], 韶关: [113.7964, 24.7028], }; var planePath = "path://M1705.06,1318.313v-89.254l-319.9-221.799l0.073-208.063c0.521-84.662-26.629-121.796-63.961-121.491c-37.332-0.305-64.482,36.829-63.961,121.491l0.073,208.063l-319.9,221.799v89.254l330.343-157.288l12.238,241.308l-134.449,92.931l0.531,42.034l175.125-42.917l175.125,42.917l0.531-42.034l-134.449-92.931l12.238-241.308L1705.06,1318.313z"; var convertData1 = function (data) { var res = []; for (var i = 0; i < data.length; i++) { var dataItem = data[i]; var fromCoord = geoCoordMap1[dataItem[1].name]; var toCoord = geoCoordMap1[dataItem[0].name]; if (fromCoord && toCoord) { res.push({ fromName: dataItem[1].name, toName: dataItem[0].name, coords: [fromCoord, toCoord], value: dataItem[1].value, }); } } return res; }; var YCData = [ [ { name: "哈尔滨" }, { name: "乌鲁木齐", value: 10, }, ], [ { name: "哈尔滨" }, { name: "长沙", value: 20, }, ], [ { name: "哈尔滨" }, { name: "北京", value: 30, }, ], ]; var XAData = [ [{ name: "西安" }, { name: "北京", value: 100 }], [{ name: "西安" }, { name: "上海", value: 100 }], [{ name: "西安" }, { name: "广州", value: 100 }], [{ name: "西安" }, { name: "西宁", value: 100 }], [{ name: "西安" }, { name: "银川", value: 100 }], ]; var series1 = []; [["哈尔滨", YCData]].forEach(function (item, i) { series1.push( { name: item[0], type: "lines", zlevel: 1, effect: { show: true, period: 6, trailLength: 0.7, color: "red", //arrow箭头的颜色 symbolSize: 3, }, lineStyle: { normal: { color: "pink", //color[i] width: 0, curveness: 0.2, }, }, data: convertData1(item[1]), }, // { // name: item[0], // type: "lines", // zlevel: 2, // symbol: "circle", //['none', 'arrow'], // symbolSize: 10, // effect: { // show: true, // period: 6, // trailLength: 0, // symbol: planePath, // symbolSize: 15, // }, // itemStyle: { // normal: { // color: "gree", //color[i] // }, // }, // lineStyle: { // normal: { // color: "#548df8", //color[i] // width: 1, // opacity: 0.6, // curveness: 0.2, // }, // }, // data: convertData1(item[1]), // }, { type: "lines", zlevel: 2, effect: { show: true, period: 4, trailLength: 0.02, symbol: "arrow", symbolSize: 5, }, lineStyle: { normal: { color: "#00FAFA", width: 2, opacity: 0.6, curveness: 0.2, }, }, data: convertData1(item[1]), }, { name: item[0], type: "effectScatter", coordinateSystem: "geo", zlevel: 2, rippleEffect: { // brushType: "stroke", }, label: { normal: { show: false, position: "right", formatter: "{b}", }, }, symbolSize: function (val) { return val[2] / 8; }, itemStyle: { show: false, normal: { color: "#548df8", //color[i] }, emphasis: { areaColor: "#2B91B7", }, }, data: item[1].map(function (dataItem) { return { name: dataItem[1].name, value: geoCoordMap1[dataItem[1].name].concat([ dataItem[1].value, ]), }; }), } ); }); this.series1 = series1; let self = this; option = { tooltip: { show: true, formatter: function (params) { console.log("params11", params); if (params.data) { if (params.seriesType != "lines") { return `${params.name}:</br> <span style="font-size:10px">总数:${ params.data.devicesCount ? params.data.devicesCount : 0 }家</span></br> <span style="font-size:10px">金额:${ params.data.value }万元</span>`; } else { return `${ params.data.fromName == "乌鲁木齐" ? "新疆" : params.data.fromName == "长沙" ? "湖南" : "北京" }</br> <span style="font-size:10px">金额:${ params.data.value ? params.data.value : 0 }万元</span></br>`; } } else { return; } }, textStyle: { align: "left", }, }, visualMap: { type: "continuous", text: ["单位数量", "0"], showLabel: true, seriesIndex: [0], min: 0, max: mapData[0].value, inRange: { color: ["#d0d0df", "#0303ff "], }, textStyle: { color: "#fff", }, bottom: "30%", right: "20", itemWidth: 10, }, grid: { left: "12%", right: "10%", bottom: "14%", top: "16%", }, geo: { roam: false, map: "china", layoutCenter: ["50%", "50%"], layoutSize: "110%", label: { show: true, color: "#fff", emphasis: { show: false, }, }, scaleLimit: { min: 1, max: 10, }, itemStyle: { emphasis: { areaColor: "#2b91b7", }, }, // regions: [], regions: mapData1,//定义默认高亮的数据及配置 }, series: [ { type: "map", map: "china", roam: false, geoIndex: 0, label: { show: false, }, data: mapData, }, ...series1, ], }; myChart.setOption(option);
vue文件
<template> <div class="echarts-class" :key="pindex"> <echarts :option="option" :echartClick="clickMap" :key="pindex"></echarts> <!-- <MapDialog ref="MapDialog"></MapDialog> --> </div> </template> <script> // import MapDialog from "../map-dialog"; export default { components: { MapDialog, }, props: {}, data() { return { option: null, mapData: [ { name: "北京", devicesCount: 100, //总数 value: 10, //使用个数 }, { name: "天津", devicesCount: 50, value: 20, }, { name: "上海", devicesCount: 80, value: 30, }, { name: "重庆", devicesCount: 90, value: 40, }, { name: "河北", devicesCount: 130, value: 50, }, { name: "河南", devicesCount: 160, value: 80, }, { name: "云南", devicesCount: 110, value: 40, }, { name: "辽宁", devicesCount: 320, value: 120, }, { name: "黑龙江", devicesCount: 80, value: 40, }, { name: "湖南", devicesCount: 60, value: 10, }, { name: "安徽", devicesCount: 300, value: 270, }, { name: "山东", devicesCount: 50, value: 9, }, { name: "新疆", devicesCount: 40, value: 0, }, { name: "江苏", devicesCount: 240, value: 40, }, { name: "浙江", devicesCount: 450, value: 300, }, { name: "江西", devicesCount: 20, value: 4, }, { name: "湖北", devicesCount: 50, value: 40, }, { name: "广西", devicesCount: 10, value: 0, }, { name: "甘肃", devicesCount: 20, value: 1, }, { name: "山西", devicesCount: 230, value: 140, }, { name: "内蒙古", devicesCount: 200, value: 0, }, { name: "陕西", devicesCount: 30, value: 40, }, { name: "吉林", devicesCount: 77, value: 40, }, { name: "福建", devicesCount: 55, value: 8, }, { name: "贵州", devicesCount: 55, value: 7, }, { name: "广东", devicesCount: 44, value: 6, }, { name: "青海", devicesCount: 33, value: 5, }, { name: "西藏", devicesCount: 10, value: 4, }, { name: "四川", devicesCount: 99, value: 20, }, { name: "宁夏", devicesCount: 145, value: 40, }, { name: "海南", devicesCount: 122, value: 90, }, { name: "台湾", devicesCount: 10, value: 0, }, { name: "香港", devicesCount: 0, value: 0, }, { name: "澳门", devicesCount: 0, value: 0, }, ], mapData1: [ { name: "黑龙江", devicesCount: 80, value: 40, selected: true,//默认高亮 //定义默认选中-的高亮颜色 emphasis: { itemStyle: { areaColor: "#8dcfa3", }, }, }, { name: "新疆", devicesCount: 40, value: 0, selected: true,//默认高亮 //定义默认选中-的高亮颜色 emphasis: { itemStyle: { areaColor: "#2b91b7", }, }, }, { name: "湖南", devicesCount: 60, value: 10, selected: true,//默认高亮 //定义默认选中-的高亮颜色 emphasis: { itemStyle: { areaColor: "#2b91b7", }, }, }, { name: "北京", devicesCount: 100, //总数 value: 10, //使用个数 selected: true,//默认高亮 //定义默认选中-的高亮颜色 emphasis: { itemStyle: { areaColor: "#2b91b7", }, }, }, ], series1: [], pindex: 0, }; }, computed: {}, watch: {}, created() {}, mounted() { this.initMap(); // this.add() }, methods: { clickMap(params) { console.log("111111", params); let list = this.mapData1.map((item) => { return item.name; }); // if(list.indexOf(params.name)>-1){ // // 可以点击 // } if (params.name == "黑龙江") { // 可以点击 // this.$emit("change3"); this.add(); } // if(this.mapData1) // this.$refs.MapDialog.visible = true; // this.$refs.MapDialog.title = params.name; }, initMap() { var geoCoordMap1 = { 上海: [121.4648, 31.2891], 东莞: [113.8953, 22.901], 东营: [118.7073, 37.5513], 中山: [113.4229, 22.478], 临汾: [111.4783, 36.1615], 临沂: [118.3118, 35.2936], 丹东: [124.541, 40.4242], 丽水: [119.5642, 28.1854], 乌鲁木齐: [87.9236, 43.5883], 佛山: [112.8955, 23.1097], 保定: [115.0488, 39.0948], 兰州: [103.5901, 36.3043], 包头: [110.3467, 41.4899], 北京: [116.4551, 40.2539], 北海: [109.314, 21.6211], 南京: [118.8062, 31.9208], 南宁: [108.479, 23.1152], 南昌: [116.0046, 28.6633], 南通: [121.1023, 32.1625], 厦门: [118.1689, 24.6478], 台州: [121.1353, 28.6688], 合肥: [117.29, 32.0581], 呼和浩特: [111.4124, 40.4901], 咸阳: [108.4131, 34.8706], 哈尔滨: [127.9688, 45.368], 唐山: [118.4766, 39.6826], 嘉兴: [120.9155, 30.6354], 大同: [113.7854, 39.8035], 大连: [122.2229, 39.4409], 天津: [117.4219, 39.4189], 太原: [112.3352, 37.9413], 威海: [121.9482, 37.1393], 宁波: [121.5967, 29.6466], 宝鸡: [107.1826, 34.3433], 宿迁: [118.5535, 33.7775], 常州: [119.4543, 31.5582], 广州: [113.5107, 23.2196], 廊坊: [116.521, 39.0509], 延安: [109.1052, 36.4252], 张家口: [115.1477, 40.8527], 徐州: [117.5208, 34.3268], 德州: [116.6858, 37.2107], 惠州: [114.6204, 23.1647], 成都: [103.9526, 30.7617], 扬州: [119.4653, 32.8162], 承德: [117.5757, 41.4075], 拉萨: [91.1865, 30.1465], 无锡: [120.3442, 31.5527], 日照: [119.2786, 35.5023], 昆明: [102.9199, 25.4663], 杭州: [119.5313, 29.8773], 枣庄: [117.323, 34.8926], 柳州: [109.3799, 24.9774], 株洲: [113.5327, 27.0319], 武汉: [114.3896, 30.6628], 汕头: [117.1692, 23.3405], 江门: [112.6318, 22.1484], 沈阳: [123.1238, 42.1216], 沧州: [116.8286, 38.2104], 河源: [114.917, 23.9722], 泉州: [118.3228, 25.1147], 泰安: [117.0264, 36.0516], 泰州: [120.0586, 32.5525], 济南: [117.1582, 36.8701], 济宁: [116.8286, 35.3375], 海口: [110.3893, 19.8516], 淄博: [118.0371, 36.6064], 淮安: [118.927, 33.4039], 深圳: [114.5435, 22.5439], 清远: [112.9175, 24.3292], 温州: [120.498, 27.8119], 渭南: [109.7864, 35.0299], 湖州: [119.8608, 30.7782], 湘潭: [112.5439, 27.7075], 滨州: [117.8174, 37.4963], 潍坊: [119.0918, 36.524], 烟台: [120.7397, 37.5128], 玉溪: [101.9312, 23.8898], 珠海: [113.7305, 22.1155], 盐城: [120.2234, 33.5577], 盘锦: [121.9482, 41.0449], 石家庄: [114.4995, 38.1006], 福州: [119.4543, 25.9222], 秦皇岛: [119.2126, 40.0232], 绍兴: [120.564, 29.7565], 聊城: [115.9167, 36.4032], 肇庆: [112.1265, 23.5822], 舟山: [122.2559, 30.2234], 苏州: [120.6519, 31.3989], 莱芜: [117.6526, 36.2714], 菏泽: [115.6201, 35.2057], 营口: [122.4316, 40.4297], 葫芦岛: [120.1575, 40.578], 衡水: [115.8838, 37.7161], 衢州: [118.6853, 28.8666], 西宁: [101.4038, 36.8207], 西安: [109.1162, 34.2004], 贵阳: [106.6992, 26.7682], 连云港: [119.1248, 34.552], 邢台: [114.8071, 37.2821], 邯郸: [114.4775, 36.535], 郑州: [113.4668, 34.6234], 鄂尔多斯: [108.9734, 39.2487], 重庆: [107.7539, 30.1904], 金华: [120.0037, 29.1028], 铜川: [109.0393, 35.1947], 银川: [106.3586, 38.1775], 镇江: [119.4763, 31.9702], 长春: [125.8154, 44.2584], 长沙: [113.0823, 28.2568], 长治: [112.8625, 36.4746], 阳泉: [113.4778, 38.0951], 青岛: [120.4651, 36.3373], 韶关: [113.7964, 24.7028], }; var planePath = "path://M1705.06,1318.313v-89.254l-319.9-221.799l0.073-208.063c0.521-84.662-26.629-121.796-63.961-121.491c-37.332-0.305-64.482,36.829-63.961,121.491l0.073,208.063l-319.9,221.799v89.254l330.343-157.288l12.238,241.308l-134.449,92.931l0.531,42.034l175.125-42.917l175.125,42.917l0.531-42.034l-134.449-92.931l12.238-241.308L1705.06,1318.313z"; var convertData1 = function (data) { var res = []; for (var i = 0; i < data.length; i++) { var dataItem = data[i]; var fromCoord = geoCoordMap1[dataItem[1].name]; var toCoord = geoCoordMap1[dataItem[0].name]; if (fromCoord && toCoord) { res.push({ fromName: dataItem[1].name, toName: dataItem[0].name, coords: [fromCoord, toCoord], value: dataItem[1].value, }); } } return res; }; var YCData = [ [ { name: "哈尔滨" }, { name: "乌鲁木齐", value: 10, }, ], [ { name: "哈尔滨" }, { name: "长沙", value: 20, }, ], [ { name: "哈尔滨" }, { name: "北京", value: 30, }, ], ]; var XAData = [ [{ name: "西安" }, { name: "北京", value: 100 }], [{ name: "西安" }, { name: "上海", value: 100 }], [{ name: "西安" }, { name: "广州", value: 100 }], [{ name: "西安" }, { name: "西宁", value: 100 }], [{ name: "西安" }, { name: "银川", value: 100 }], ]; var series1 = []; [["哈尔滨", YCData]].forEach(function (item, i) { series1.push( { name: item[0], type: "lines", zlevel: 1, effect: { show: true, period: 6, trailLength: 0.7, color: "red", //arrow箭头的颜色 symbolSize: 3, }, lineStyle: { normal: { color: "pink", //color[i] width: 0, curveness: 0.2, }, }, data: convertData1(item[1]), }, // { // name: item[0], // type: "lines", // zlevel: 2, // symbol: "circle", //['none', 'arrow'], // symbolSize: 10, // effect: { // show: true, // period: 6, // trailLength: 0, // symbol: planePath, // symbolSize: 15, // }, // itemStyle: { // normal: { // color: "gree", //color[i] // }, // }, // lineStyle: { // normal: { // color: "#548df8", //color[i] // width: 1, // opacity: 0.6, // curveness: 0.2, // }, // }, // data: convertData1(item[1]), // }, { type: "lines", zlevel: 2, effect: { show: true, period: 4, trailLength: 0.02, symbol: "arrow", symbolSize: 5, }, lineStyle: { normal: { color: "#00FAFA", width: 2, opacity: 0.6, curveness: 0.2, }, }, data: convertData1(item[1]), }, { name: item[0], type: "effectScatter", coordinateSystem: "geo", zlevel: 2, rippleEffect: { // brushType: "stroke", }, label: { normal: { show: false, position: "right", formatter: "{b}", }, }, symbolSize: function (val) { return val[2] / 8; }, itemStyle: { show: false, normal: { color: "#548df8", //color[i] }, emphasis: { areaColor: "#2B91B7", }, }, data: item[1].map(function (dataItem) { return { name: dataItem[1].name, value: geoCoordMap1[dataItem[1].name].concat([ dataItem[1].value, ]), }; }), } ); }); this.series1 = series1; let self = this; self.option = { tooltip: { show: true, formatter: function (params) { console.log("params11", params); if (params.data) { if (params.seriesType != "lines") { return `${params.name}:</br> <span style="font-size:10px">总数:${ params.data.devicesCount ? params.data.devicesCount : 0 }家</span></br> <span style="font-size:10px">金额:${ params.data.value }万元</span>`; } else { return `${ params.data.fromName == "乌鲁木齐" ? "新疆" : params.data.fromName == "长沙" ? "湖南" : "北京" }</br> <span style="font-size:10px">金额:${ params.data.value ? params.data.value : 0 }万元</span></br>`; } } else { return; } }, textStyle: { align: "left", }, }, visualMap: { type: "continuous", text: ["单位数量", "0"], showLabel: true, seriesIndex: [0], min: 0, max: self.mapData[0].value, inRange: { color: ["#F6C879", "#CE3100 "], }, textStyle: { color: "#fff", }, bottom: "30%", right: "20", itemWidth: 10, }, grid: { left: "12%", right: "10%", bottom: "14%", top: "16%", }, geo: { roam: false, map: "china", layoutCenter: ["50%", "50%"], layoutSize: "110%", label: { show: true, color: "#fff", emphasis: { show: false, }, }, scaleLimit: { min: 1, max: 10, }, itemStyle: { emphasis: { areaColor: "#fff464", }, }, regions: [], }, series: [ { type: "map", map: "china", roam: false, geoIndex: 0, label: { show: false, }, data: self.mapData, }, // ...series1, ], }; }, add() { let self = this; self.option.geo.regions = self.mapData1; self.option.series = [ { type: "map", map: "china", roam: false, geoIndex: 0, label: { show: false, }, data: self.mapData, }, ...self.series1, ]; }, // 调用此方法-地图高亮 addRegions() { let self = this; self.option.geo.regions = self.mapData1; }, // 调用此方法-地图有轨迹 addSeries() { let self = this; self.option.series = [ { type: "map", map: "china", roam: false, geoIndex: 0, label: { show: false, }, data: self.mapData, }, ...self.series1, ]; }, delete() { let self = this; this.pindex = Math.random(); this.$nextTick(() => { self.option = {}; self.initMap(); }); }, }, }; </script> <style scoped lang='scss'> </style>

