
1、电池图
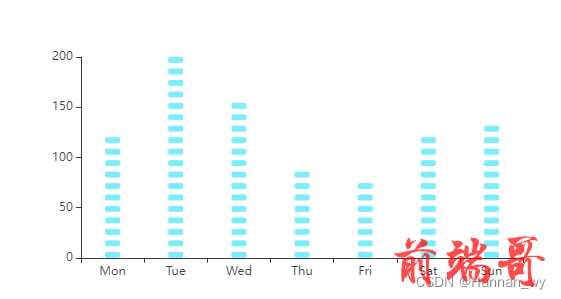
const chartInstance = this.$echarts.init(this.$refs.bar) const xAxisData = ['Mon', 'Tue', 'Wed', 'Thu', 'Fri', 'Sat', 'Sun'] const yAxisData = [120, 200, 150, 80, 70, 110, 130] const initOption = { color: '#7dedfc', tooltip: { trigger: 'axis', axisPointer: { crossStyle: { color: '#999' } } }, grid: { bottom: '20%', containLabel: true }, xAxis: [ { type: 'category', axisLine: { show: true, lineStyle: { color: '#3b3b3c' } }, splitLine: { show: false, lineStyle: { color: '#3b3b3c', width: 1, type: 'solid' } }, axisPointer: { type: 'shadow' }, data: xAxisData } ], yAxis: [ { type: 'value', axisLabel: { color: '#3b3b3c' }, axisLine: { show: true, lineStyle: { color: '#3b3b3c' } }, splitLine: { show: false, lineStyle: { color: '#7dedfc', width: 1, type: 'solid' } }, nameTextStyle: { rich: { legend: { width: 12, height: 4, backgroundColor: 'red' }, value: { color: '#FF8C00' } } } } ], series: [ { type: 'pictorialBar', // 设置类型为象形柱状图 symbol: 'roundRect', // 图形类型,带圆角的矩形 barWidth: '11%', // 柱图宽度 barMaxWidth: '20%', // 最大宽度 symbolMargin: '3', // 图形垂直间隔 animationDelay: (dataIndex, params) => { // 每个图形动画持续时间 return params.index * 50 }, itemStyle: { normal: { color: '#7dedfc' } }, z: 1, symbolRepeat: true, // 图形是否重复 symbolSize: [15, 6], // 图形元素的尺寸 data: yAxisData, // Y轴数据 animationEasing: 'elasticOut', // 动画效果, label: { normal: { show: true, position: 'top', textStyle: { color: '#fff' } } } } ] } chartInstance.setOption(initOption)
2、3D立体柱状图
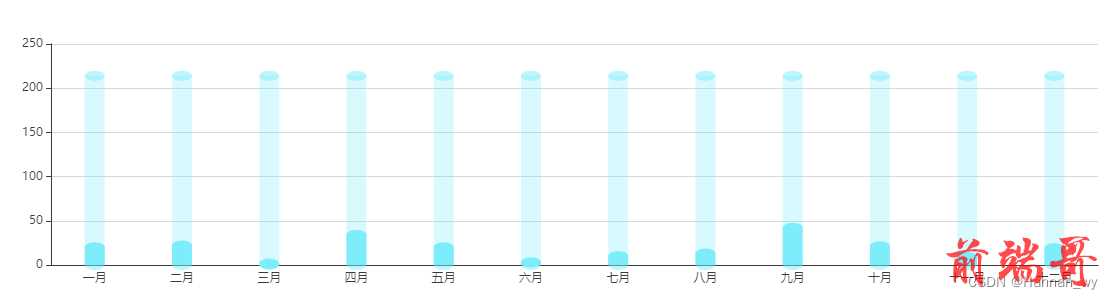
const xAxisData = ['一月', '二月', '三月', '四月', '五月', '六月', '七月', '八月', '九月', '十月', '十一月', '十二月'] const yAxisData = [20, 22, 1, 34, 20, 3, 10, 13, 42, 21, 9, 19] const totalArr = [] const bottomArr = [] const sum = yAxisData.reduce(function (total, value) { return total + value }, 0) yAxisData.forEach(e => { totalArr.push(sum) // 若不喜欢背景 可去掉 bottomArr.push(1) }) const chartInstance = this.$echarts.init(this.$refs.chemical_bar) const initOption = { grid: { x: 40, y: 40, x2: 30, y2: 30, containLabel: true }, tooltip: { trigger: 'axis', formatter: function (value) { return value[0].name + '<br/>' + value[0].marker + value[0].data } }, xAxis: { type: 'category', axisLine: { show: true, lineStyle: { color: this.fontColor_ } }, axisTick: { show: false }, axisPointer: { type: 'shadow' }, data: xAxisData }, yAxis: [ { type: 'value', axisLine: { show: true, lineStyle: { color: this.fontColor_ } }, splitLine: { show: true, lineStyle: { color: this.fontColor_, opacity: 0.2 } }, axisLabel: { color: this.fontColor_ } } ], series: [ { name: '月份', type: 'pictorialBar', symbolSize: [20, 10], symbolOffset: [0, -5], symbolPosition: 'end', itemStyle: { color: this.activeColor_ }, z: 10, data: yAxisData }, { name: '月份', type: 'bar', barWidth: 20, barGap: '-100%', itemStyle: { color: this.activeColor_ }, data: yAxisData }, { name: '月份', type: 'pictorialBar', symbolSize: [20, 12], symbolOffset: [0, 5], itemStyle: { color: this.activeColor_, opacity: 0.5 }, z: 10, data: bottomArr }, { name: '月份', // 为顶上的图片,若不喜欢背景柱 可以去掉 type: 'pictorialBar', symbolSize: [20, 10], symbolOffset: [0, -5], symbolPosition: 'end', itemStyle: { color: this.activeColor_, opacity: 0.5 }, z: 10, data: totalArr }, { name: '月份', // 为背景柱,不喜欢 可以去掉 type: 'bar', barWidth: 20, barGap: '-100%', itemStyle: { color: this.activeColor_, opacity: 0.3 }, z: 0, data: totalArr } ] } chartInstance.setOption(initOption)

