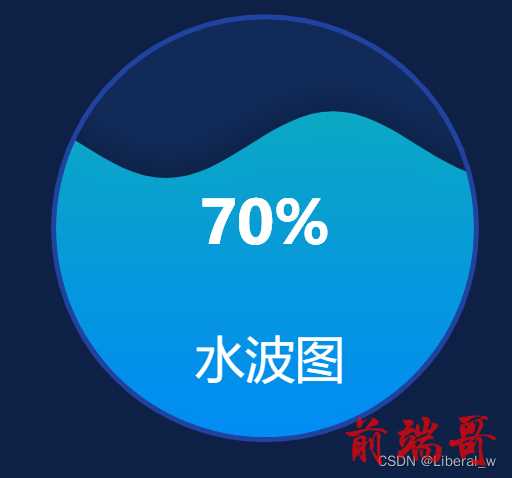
开发的项目中需要实现这样一个水波图,例如下图

在echarts官网中找了很久没找到,后面是在Echarts社区中找到的,实现了大部分的样式,但是还有一些数据的展示没有实现。水波图的数值展示是默认整数百分比,我的需求是需要保留两位小数。
先展示一下在社区中找到的水波图代码如下:
option = { backgroundColor: "#0e2147", title: { show: true, text: '违规项', x: '50%', y: '60%', z: 10, textAlign: 'center', textStyle: { color: '#ffffff', fontSize: 68, fontWeight: 500 }, }, series: [{ name: '违规项', type: 'liquidFill', radius: '60%', center: ['50%', '45%'], data: [70/100], label:{ normal:{ textStyle:{ color: '#ffffff', fontSize: 68, } } }, color: ['#4366f3'], backgroundStyle: { color: 'rgba(39,115,229,0.12)' }, outline: { borderDistance: 0, itemStyle: { borderWidth: 5, borderColor: 'rgba(49,102,255,0.5)', } }, // amplitude: 0, }] };
发现水波图的类型是“liquidFill”,在官网中没有找到这个类型,后面发现是需要单独封装的类型,需要单独下载安装包。
我安装的依赖版本(水波图的类型应该是在echarts 5版本支持,小伙伴们使用时注意版本):
echarts:5.2.2
echarts-liquidfill:3.1.0
主要修改的代码是series里面的data控制数据展示和series里面的color控制水波的颜色渐变
option = { backgroundColor: "#0e2147", // 背景颜色 title: { show: true, text: '水波图', // 标题名字 x: '50%', y: '60%', z: 10, textAlign: 'center', // 文字位置 textStyle: { // 文字样式设置 color: '#ffffff', fontSize: 50, fontWeight: 500 }, }, series: [{ name: '水波图', type: 'liquidFill', radius: '60%', center: ['50%', '45%'], data: [ { value: [55.2 / 100], label: { normal: { formatter: `${55.2}%`, show: true, } } } ], label:{ normal:{ textStyle:{ // 数值样式设置 color: '#ffffff', fontSize: 60, } } }, color: [ { type: 'linear', x: 0, y: 1, x2: 0, y2: 0, colorStops: [ // 水波颜色渐变 { offset: 1, color: ['rgba(11,175,202,1)'], // 0% 处的颜色 }, { offset: 0, color: ['rgba(0,145,255,1)'], // 100% 处的颜色 } ], // 水波纹颜色 } ], backgroundStyle: { color: 'rgba(39,115,229,0.12)' }, outline: { borderDistance: 0, itemStyle: { borderWidth: 5, // 边 宽度 borderColor: 'rgba(49,102,255,0.5)', } }, }] };
以上是我遇到的问题,简单记录一下(虽然...但是没有找到echarts的全部类型,官网中的只是一部分),欢迎各位小伙伴来交流~
代码参考echarts社区:https://www.isqqw.com/viewer?id=17830

