背景:
产品提出需求在饼图中间放两行文字且居中
“简单,劈劈啪啪写完了”
产品再提出你这个没有自适应啊,屏幕放大、缩小你这个就没有居中了,甚至会和饼图重叠
“emmmmm…"
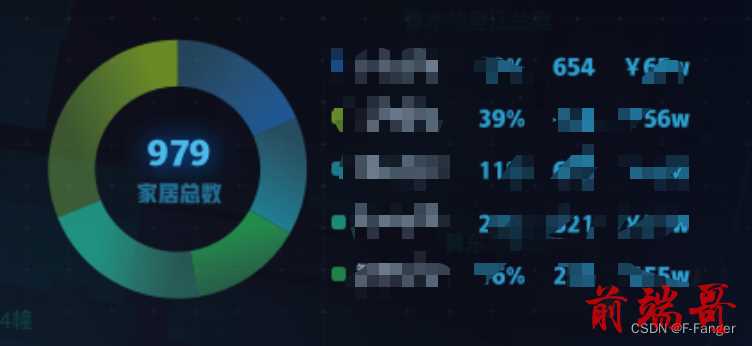
UI图如下: 
方案一:使用tittle(不能自适应)
方案二:在series中配置label(适用图表居中的情况,我这个图表在左边不适用)
方案三:在series中再加一个type: ‘gauge’(能居中且支持自适应)
代码如下:(这里只提供了series的配置)
series: [{ name: '设备总数', type: 'pie', radius: ['35%', '60%'], center: ['25%', '45%'], // 图形位置 label: { show: false }, selectedMode: false, data: data }, { name: '中间文字', z: 100, type: 'gauge', radius: '-50%', center: ['25%', '45%'],// 需和type: 'pie'中的center一致 // 配置中间的数字的样式 detail: { // 调节数字位置 offsetCenter: [-1,-10], fontSize: fontSize(18), fontFamily: fontFamily.fontFamily95W, color: 'rgba(75, 186, 233, 1)', }, pointer: { show: false, }, axisTick: { show: false, }, axisLine: { show: false, }, splitLine: { show: false, }, axisLabel: { show: false, }, // 中间的字和数字 数据 data: [ { value: totalNum, name:'家居总数', title:{// 配置“家居总数”的样式 show:true, fontSize: fontSize(12), fontFamily: fontFamily.fontFamily65W, color: 'rgba(50, 197, 255, .5)', offsetCenter:[0,'-20%'] } }, ], }, ]
实现后的成果图如下:


