安装
| npm install echarts --save |
全局引用
main.js中配置
| |
| import * as echarts from 'echarts' |
| |
| Vue.prototype.$echarts = echarts |
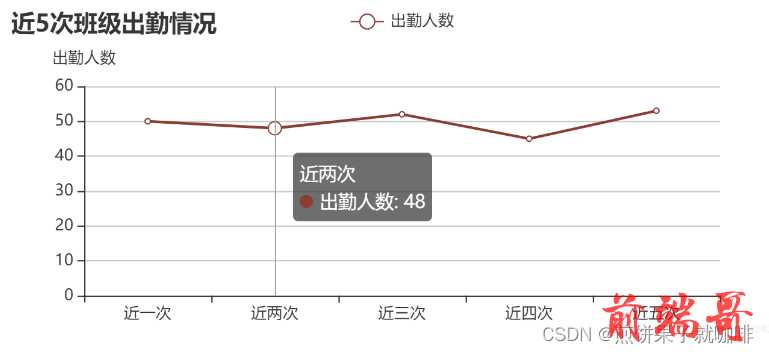
折线图
HTML部分
| <template> |
| <div class="test2" style="width:100%;height:400px;"> |
| <div id="myChart2" style="width:100%;height:278px;float:left;" /> |
| </div> |
| </template> |
JS部分
| <script> |
| export default { |
| name: 'BrokenLine', |
| data() { |
| return { |
| myChart2: '', |
| formData: { |
| title: { |
| text: '历史数据分析', |
| subtext: '', |
| x: 'left' |
| }, |
| tooltip: { |
| trigger: 'axis' |
| }, |
| xAxis: { |
| type: 'category', |
| data: [], |
| name: '' |
| |
| |
| |
| |
| |
| }, |
| yAxis: { |
| type: 'value', |
| name: '出勤人数', |
| |
| |
| |
| |
| |
| axisLabel: { |
| formatter: this.setValue() |
| } |
| }, |
| legend: { |
| orient: 'vertical', |
| x: 'center', |
| y: 'top', |
| data: ['出勤人数'] |
| }, |
| series: [ |
| { |
| name: '体检结果', |
| data: [], |
| type: 'line' |
| } |
| ] |
| } |
| } |
| }, |
| mounted: function() { |
| this.drawLine1() |
| }, |
| methods: { |
| drawLine1() { |
| |
| this.myChart2 = this.$echarts.init(document.getElementById('myChart2')) |
| |
| this.myChart2.setOption(this.formData) |
| }, |
| formLoad(form) { |
| const mapList = form |
| const then = this |
| mapList.forEach(item => { |
| |
| then.formData.xAxis.data.push(item.time) |
| }) |
| this.myChart2.setOption(this.formData) |
| }, |
| setValue(value) { |
| var texts = [] |
| if (value === 0) { |
| texts.push('woo') |
| } else if (value <= 1) { |
| texts.push('好') |
| } else if (value <= 2) { |
| texts.push('很好') |
| } else if (value <= 3) { |
| texts.push('非常好') |
| } else { |
| texts.push('完美') |
| } |
| return texts |
| } |
| } |
| } |
| </script> |
| |
| <style scoped> |
| |
| </style> |
仅做记录!!!!


