大致使用步骤:
1. 安装:npm install echarts -S
2. 使用方式(三种)
1. 导入echarts在组件内使用
2. 导入全局 挂载原型上 全局使用
3. 开发成vue插件
3. 使用 -main.js(在这里使用第二种)
1. import * as echarts from 'echarts'
Vue.prototype.$echarts = echarts;
2. 直接使用
this.$echarts.xxx
第一步建立vue2空项目,或者打开现有项目
第二步cmd安装插件库:npm install echarts --save
第三步在main.js(在这里使用第二种)
import * as echarts from 'echarts'
Vue.prototype.$echarts = echarts;
第五步写echatr使用的时候直接使用this.$echarts.xxx就可以了
比如
<template>
<div class="">
<!-- 为 ECharts 准备一个定义了宽高的 DOM -->
<div id="main" style="width: 600px;height:400px;"></div>
</div>
</template>
<script>
export default {
name: 'HoMe',
components: {},
mounted(){
// 基于准备好的dom,初始化echarts实例
var myChart = this.$echarts.init(document.getElementById('main'))
// 指定图表的配置项和数据
var option = {
title: {
text: 'ECharts 入门示例'
},
tooltip: {},
legend: {
data: ['销量']
},
xAxis: {
data: ['衬衫', '羊毛衫', '雪纺衫', '裤子', '高跟鞋', '袜子']
},
yAxis: {},
series: [
{
name: '销量',
type: 'bar',
data: [5, 20, 36, 10, 10, 20]
}
]
}
// 使用刚指定的配置项和数据显示图表。
myChart.setOption(option)
}
}
</script>
<style>
</style>
ok,如果你想使用其他的示例图表可以去官网替换掉 option里面的东西https://echarts.apache.org/examples/zh/index.html
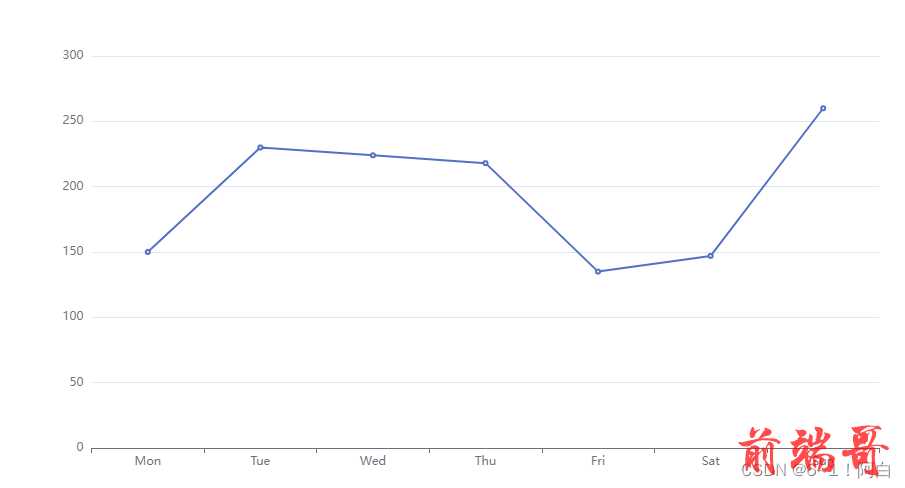
比如
option = {
xAxis: {
type: 'category',
data: ['Mon', 'Tue', 'Wed', 'Thu', 'Fri', 'Sat', 'Sun']
},
yAxis: {
type: 'value'
},
series: [
{
data: [150, 230, 224, 218, 135, 147, 260],
type: 'line'
}
]
};

我们可以基于他进行二次操作

