A、Echarts
a、安装:npm i echarts@4.9.0
b、在main.js中配置:
import * as echarts from 'echarts'
Vue.prototype.echarts = echarts
c、在vue组件的虚拟DOM中定义echarts的挂载点
d、对echarts的各个配置项进行配置(以柱状图bar为例)
title:图表的标题
tooltip:鼠标悬浮在图表上时显示的提示信息
xAxis:x轴的文本
yAxis:y轴的文本
series:是一个数组,包含多个对象,一个对象就是图表中一组柱子
type:表示的图表的类型(bar表示柱状态图、line表示折线图、pie表示饼图......)
data:是一个数组,有多少个单元就显示多少个柱子
B、vue-echarts模块的使用
a、安装:npm i vue-echarts
b、导入:
import 'echarts' import VueECharts from "vue-echarts"; import "echarts/lib/chart/bar";
c、在vue组件中注册vue-echarts
import Echarts from 'vue-echarts' export default { name: 'App', components: { 'v-chart':VueECharts } }
d、在vue组件的data函数中定义vue-echarts配置项
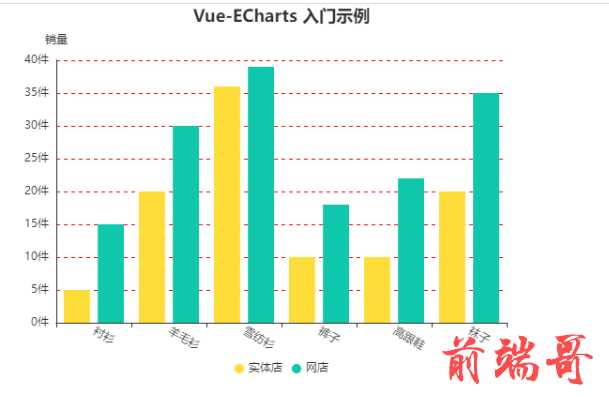
data(){ return { bar: { color: ["#ffdd38", "#0fc7ab"], // 柱状图颜色设置 title: { text: "Vue-ECharts 入门示例", left: 'center' //标题居中 }, tooltip: {}, animation: false, //不显示动画效果 legend: { //图例设置 //show: false, //是否显示图例 icon: "circle", // 将图例设置成原型 bottom: 0, //图例显示的位置 left: "center", itemWidth: 10, itemHeight: 10, }, xAxis: { //x轴显示的内容 data: ["衬衫","羊毛衫","雪纺衫","裤子","高跟鞋","袜子"], axisLabel: { rotate: -30 //显示内容的倾斜度 } }, yAxis: [ { type: 'value', name: '销量', min: 0, //设置y轴刻度的最小值 max: 40, //设置y轴刻度的最大值 interval: 5, //y轴的间隔数 axisLabel: { //y轴标签的显示格式 formatter: '{value}件' }, splitLine: { //y轴分隔线 show: true, //显示分隔线 lineStyle: { type: "dashed", //线型 color: 'red' //线条颜色 } }, axisLine: { show: true, //是否显示坐标轴轴线 }, axisTick: { show: false, //去掉y轴刻度线 } } ], series: [ { name: "实体店", type: "bar", data: [5,20,36,10,10,20] }, { name: "网店", type: "bar", data: [15,30,39,18,22,35] } ] } } } }
e、在vue组件的DOM中应用
<template> <div> <v-chart :options="woniu"></v-chart> </div> </template>
实现的效果图
f、在app.vue中引用
B、AntV数据可视化
简介: AntV 是一套专业的数据可视化规范,这套规范的目的是为了让可视化的使用者更懂数据可视化。这套规范是蚂蚁金服在可视化建设过程中的理论沉淀,它可以很好得指引产品经理,设计师和工程师怎样正确得使用可视化及可视化技术,规避常见的错误。
2、全局使用方法
yarn add @antv/g2
或
npm install @antv/g2
(2)全局使用(在main.js中挂在到vue原型实例中)
const G2 = require('@antv/g2') Vue.prototype.$G2 = G2
(3)vue组件中能够直接在mounted生命周期中直接使用
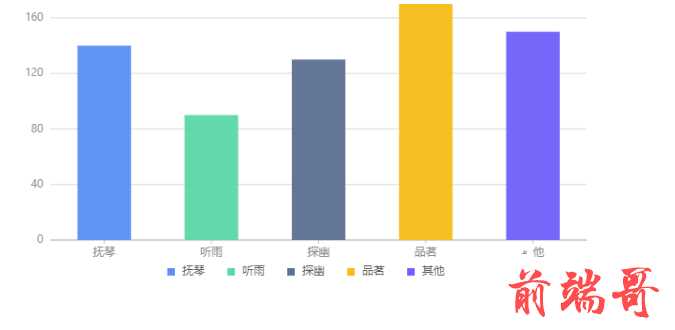
<template> <div id="c1"></div> </template> //script内容 export default { name: "AntV", data(){ return { msg: "", chart: null, data: [ { genre: "运动", sold: 275 }, { genre: "行动", sold: 115 }, { genre: "动作", sold: 120 }, { genre: "设计", sold: 350 }, { genre: "其他", sold: 150 } ] } }, methods:{ initComponent() { const chart = new this.$G2.Chart({ container: "c1", width: 600, height: 300 }); chart.source(this.data); chart .interval() .position("genre*sold") .color("genre"); this.chart = chart; this.chart.render(); } }, mounted() { this.initComponent() } }
(4)在app.vue中引用
代码的运行效果图
3、按需使用方法
(1)安装antv/g2
yarn add @antv/g2 或 npm install @antv/g2
(2)在组件中按需引入
<template> <div> <div id="l1"></div> </div> </template> //<script>部分 import { Chart } from "@antv/g2"; export default { name: "AntV2", data() { return { year: [ { year: "1991", value: 3 }, { year: "1992", value: 4 }, { year: "1993", value: 3.5 }, { year: "1994", value: 5 }, { year: "1995", value: 4.9 }, { year: "1996", value: 6 }, { year: "1997", value: 7 }, { year: "1998", value: 9 }, { year: "1999", value: 13 } ] }; }, methods: { initLineChart(){ //创建图表对象 const chart = new Chart({ container:'l1',//表示挂载图表的DOM元素的id autoFit:true,//开启自适应 height:500//图表的高度 }); chart.data(this.years);//设置图表中的数据 chart.scale({//设置图标的刻度 year:{//刻度的数据依存 range:[0,1]//刻度数据的范围 }, value:{//刻度值,最小是0 min:0, nice:true } }); chart.tooltip({//鼠标悬停时的信息 showCrosshairs:true,//展现tooltip辅助线 shared:true }); chart .line()//图表的类型 .position('year*value') .label('value'); chart.point().position('year*value'); chart.render();//渲染折线图 } }, mounted() { this.initLineChart() } }
(3)在app.vue中引用
运行效果图

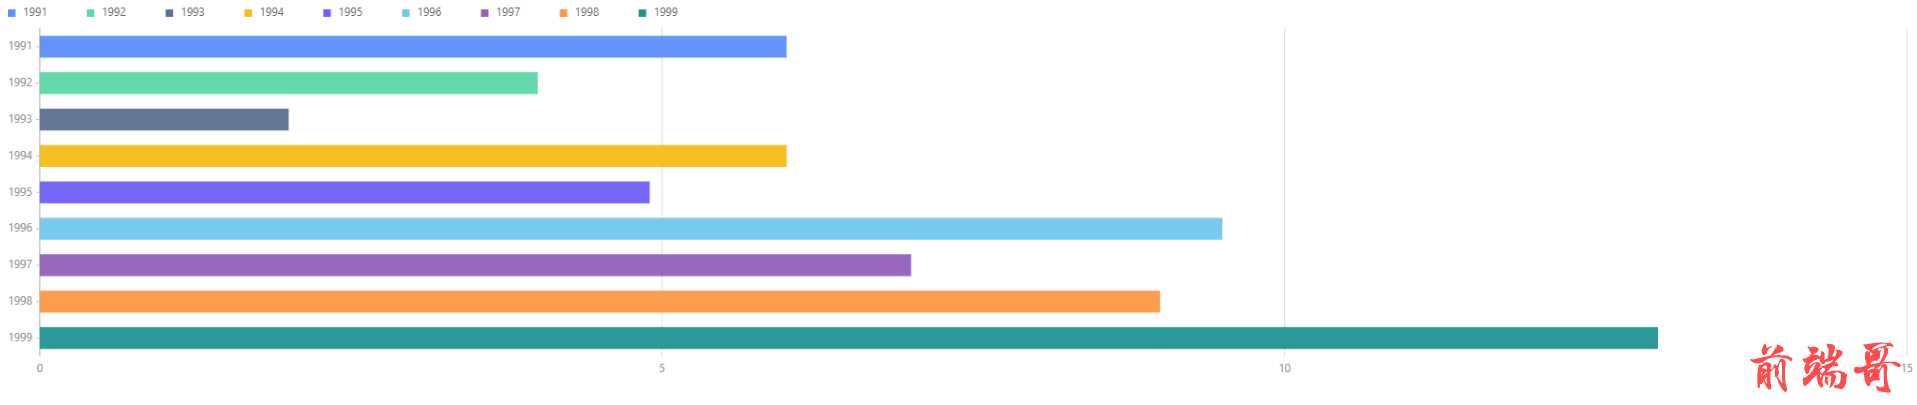
4、水平柱状图
(1)安装:npm i @antv/g2plot
(2)在组件中引入:import { Bar } from "@antv/g2plot"
import {Bar} from '@antv/g2plot'
(3)创建图表对象:
<template> <div> <div id="l2"></div> </div> </template> //<script>里内容 import { Bar } from "@antv/g2plot" export default { name: "AntV2", data() { return { years: [ { year: "1991", value: 3 }, { year: "1992", value: 4 }, { year: "1993", value: 3.5 }, { year: "1994", value: 5 }, { year: "1995", value: 4.9 }, { year: "1996", value: 6 }, { year: "1997", value: 7 }, { year: "1998", value: 9 }, { year: "1999", value: 13 } ] }; }, methods: { initBar(){ //第一个参数表示挂载图表的DOM元素的id const bar = new Bar('l2', { data:this.years, xField: 'value', yField: 'year', seriesField: 'year', legend: { position: 'top-left', } }); bar.render(); } }, mounted() { this.initBar() } }
(4)在app.vue中引用
代码运行的效果图