
甘特图(Gantt chart)又称为横道图、条状图(Bar chart)。其通过条状图来显示项目、进度和其他时间相关的系统进展的内在关系随着时间进展的情况。以提出者亨利·劳伦斯·甘特(Henry Laurence Gantt)先生的名字命名。
代码示例
<!DOCTYPE html> <html lang="en"> <head> <meta charset="UTF-8" /> <meta http-equiv="X-UA-Compatible" content="IE=edge" /> <meta name="viewport" content="width=device-width, initial-scale=1.0" /> <title>Document</title> <script src="https://cdn.jsdelivr.net/npm/echarts@5.4.1/dist/echarts.min.js"></script> </head> <body> <!-- 为 ECharts 准备一个定义了宽高的 DOM --> <div id="main" style="width: 1200px; height: 400px"></div> <script> let data = [ { list: [ { colorNum: 0, endTime: "2018-08-02 14:00:00", item: "item1", quantity: 1960, startTime: "2018-08-02 8:00:00", }, { colorNum: 1, endTime: "2018-08-04 12:00:00", item: "item2", quantity: 492, startTime: "2018-08-04 08:00:00", }, { colorNum: 2, endTime: "2018-08-04 18:00:00", item: "item3", quantity: 20837, startTime: "2018-08-04 14:00:00", }, { colorNum: 3, endTime: "2018-08-05 12:00:00", item: "item4", quantity: 3620, startTime: "2018-08-04 20:00:00", }, { colorNum: 0, endTime: "2018-08-05 24:00:00", item: "item5", quantity: 7200, startTime: "2018-08-05 14:00:00", }, ], plant: "工厂1", }, { list: [ { startTime: "2018-08-03 12:00:00", endTime: "2018-08-04 12:00:00", quantity: 20, colorNum: 0, item: "item6", }, ], plant: "工厂2", }, { list: [ { startTime: "2018-08-04 12:00:00", endTime: "2018-08-06 00:00:00", quantity: 30, colorNum: 0, item: "item7", }, { startTime: "2018-08-06 08:00:00", endTime: "2018-08-06 12:00:00", quantity: 20, colorNum: 1, item: "item8", }, { startTime: "2018-08-06 14:00:00", endTime: "2018-08-08 12:00:00", quantity: 10, colorNum: 2, item: "item9", }, { startTime: "2018-08-08 20:00:00", endTime: "2018-08-10 12:00:00", quantity: 10, colorNum: 3, item: "item10", }, ], plant: "工厂3", }, { list: [ { startTime: "2018-08-02 20:00:00", endTime: "2018-08-03 12:00:00", quantity: 20, colorNum: 1, item: "item11", }, { startTime: "2018-08-03 20:00:00", endTime: "2018-08-04 12:00:00", quantity: 15, colorNum: 2, item: "item12", }, { startTime: "2018-08-04 20:00:00", endTime: "2018-08-05 12:00:00", quantity: 15, colorNum: 3, item: "item13", }, ], plant: "工厂4", }, ]; let start_ = "2018-08-02 00:00:00", end_ = "2018-11-05 24:00:00"; //自定义时间 let seriesData = []; let yAxisData_plant = []; //工厂名 data.forEach((item, index) => { yAxisData_plant.push(item.plant); let bgColor; item.list.forEach((listItem, listIndex) => { switch (listItem.colorNum) { case 0: bgColor = "rgba(0,187,255,.4)"; break; case 1: bgColor = "rgba(80,227,194,.4)"; break; case 2: bgColor = "rgba(255,115,115,.4)"; break; case 3: bgColor = "rgba(255,207,107,.4)"; break; default: bgColor = "rgba(0,187,255,.4)"; } let startTime = new Date(listItem.startTime).getTime(); let endTime = new Date(listItem.endTime).getTime(); seriesData.push({ name: listItem.item, value: [index, startTime, endTime, listItem.quantity], itemStyle: { normal: { color: bgColor, }, }, }); }); }); option = { backgroundColor: "#26263C", tooltip: { formatter: function (params) { //console.log(params) return params.marker + params.name; }, }, grid: { top: 48, left: 100, right: 50, bottom: 50, height: 300, }, dataZoom: [ { show: true, type: "slider", filterMode: "none", realtime: false, height: 10, top: 370, startValue: new Date(start_).getTime(), endValue: new Date(start_).getTime() + 3600 * 24 * 1000 * 7, minValueSpan: 3600 * 24 * 1000 * 7, handleIcon: "path://path://M100, 100m -75, 0a75,75 0 1,0 150,0a75,75 0 1,0 -150,0", handleSize: "120%", handleStyle: { color: "#fff", shadowColor: "rgba(0, 0, 0, 0.5)", shadowBlur: 4, }, textStyle: { color: "transparent", }, borderColor: "transparent", backgroundColor: "#D7F4FF", dataBackground: { lineStyle: { width: 0, }, areaStyle: { color: "transparent", }, }, fillerColor: "#00EBFF", labelFormatter: "", }, { type: "inside", show: true, zoomOnMouseWheel: false, moveOnMouseWheel: true, moveOnMouseMove: true, preventDefaultMouseMove: true, }, ], xAxis: { type: "time", min: new Date(start_).getTime(), max: new Date(end_).getTime(), scale: true, position: "top", splitNumber: 7, axisLabel: { show: true, textStyle: { color: "#ffffff" }, interval: 0, margin: 15, fontSize: 14, formatter: function (value, index) { var date = new Date(value); var texts = [date.getFullYear(), date.getMonth() + 1, date.getDate()].join("/"); return texts; }, }, axisLine: { show: false }, splitLine: { show: true, lineStyle: { color: "rgba(233,233,233,0.1)" }, }, axisTick: { lineStyle: { color: "#fff", }, }, }, yAxis: { axisLine: { onZero: false, show: false, }, axisLabel: { show: true, textStyle: { color: "#ffffff" }, fontSize: 14, }, splitLine: { show: true, lineStyle: { color: "rgba(233,233,233,0.1)" }, }, inverse: true, data: yAxisData_plant, }, series: [ { type: "custom", renderItem: function (params, api) { var categoryIndex = api.value(0); var start = api.coord([api.value(1), categoryIndex]); var end = api.coord([api.value(2), categoryIndex]); var height = api.size([0, 1])[1] * 0.6; var rectShape = echarts.graphic.clipRectByRect( { x: start[0], y: start[1] - 5, width: end[0] - start[0], height: 10, }, { x: params.coordSys.x, y: params.coordSys.y, width: params.coordSys.width, height: params.coordSys.height, } ); return ( rectShape && { type: "rect", shape: rectShape, style: api.style(), } ); }, encode: { x: [1, 2], y: 0, }, data: seriesData, }, ], }; // 基于准备好的dom,初始化echarts实例 var myChart = echarts.init(document.getElementById("main")); // 使用刚指定的配置项和数据显示图表。 myChart.setOption(option); </script> </body> </html>
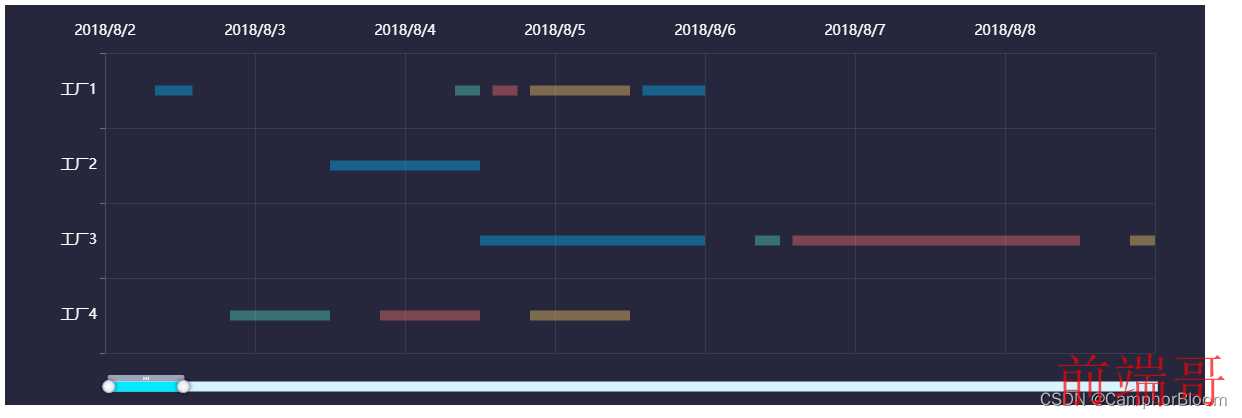
效果如下
参考: https://echarts.apache.org/examples/zh/editor.html?c=custom-gantt-flight&theme=dark

