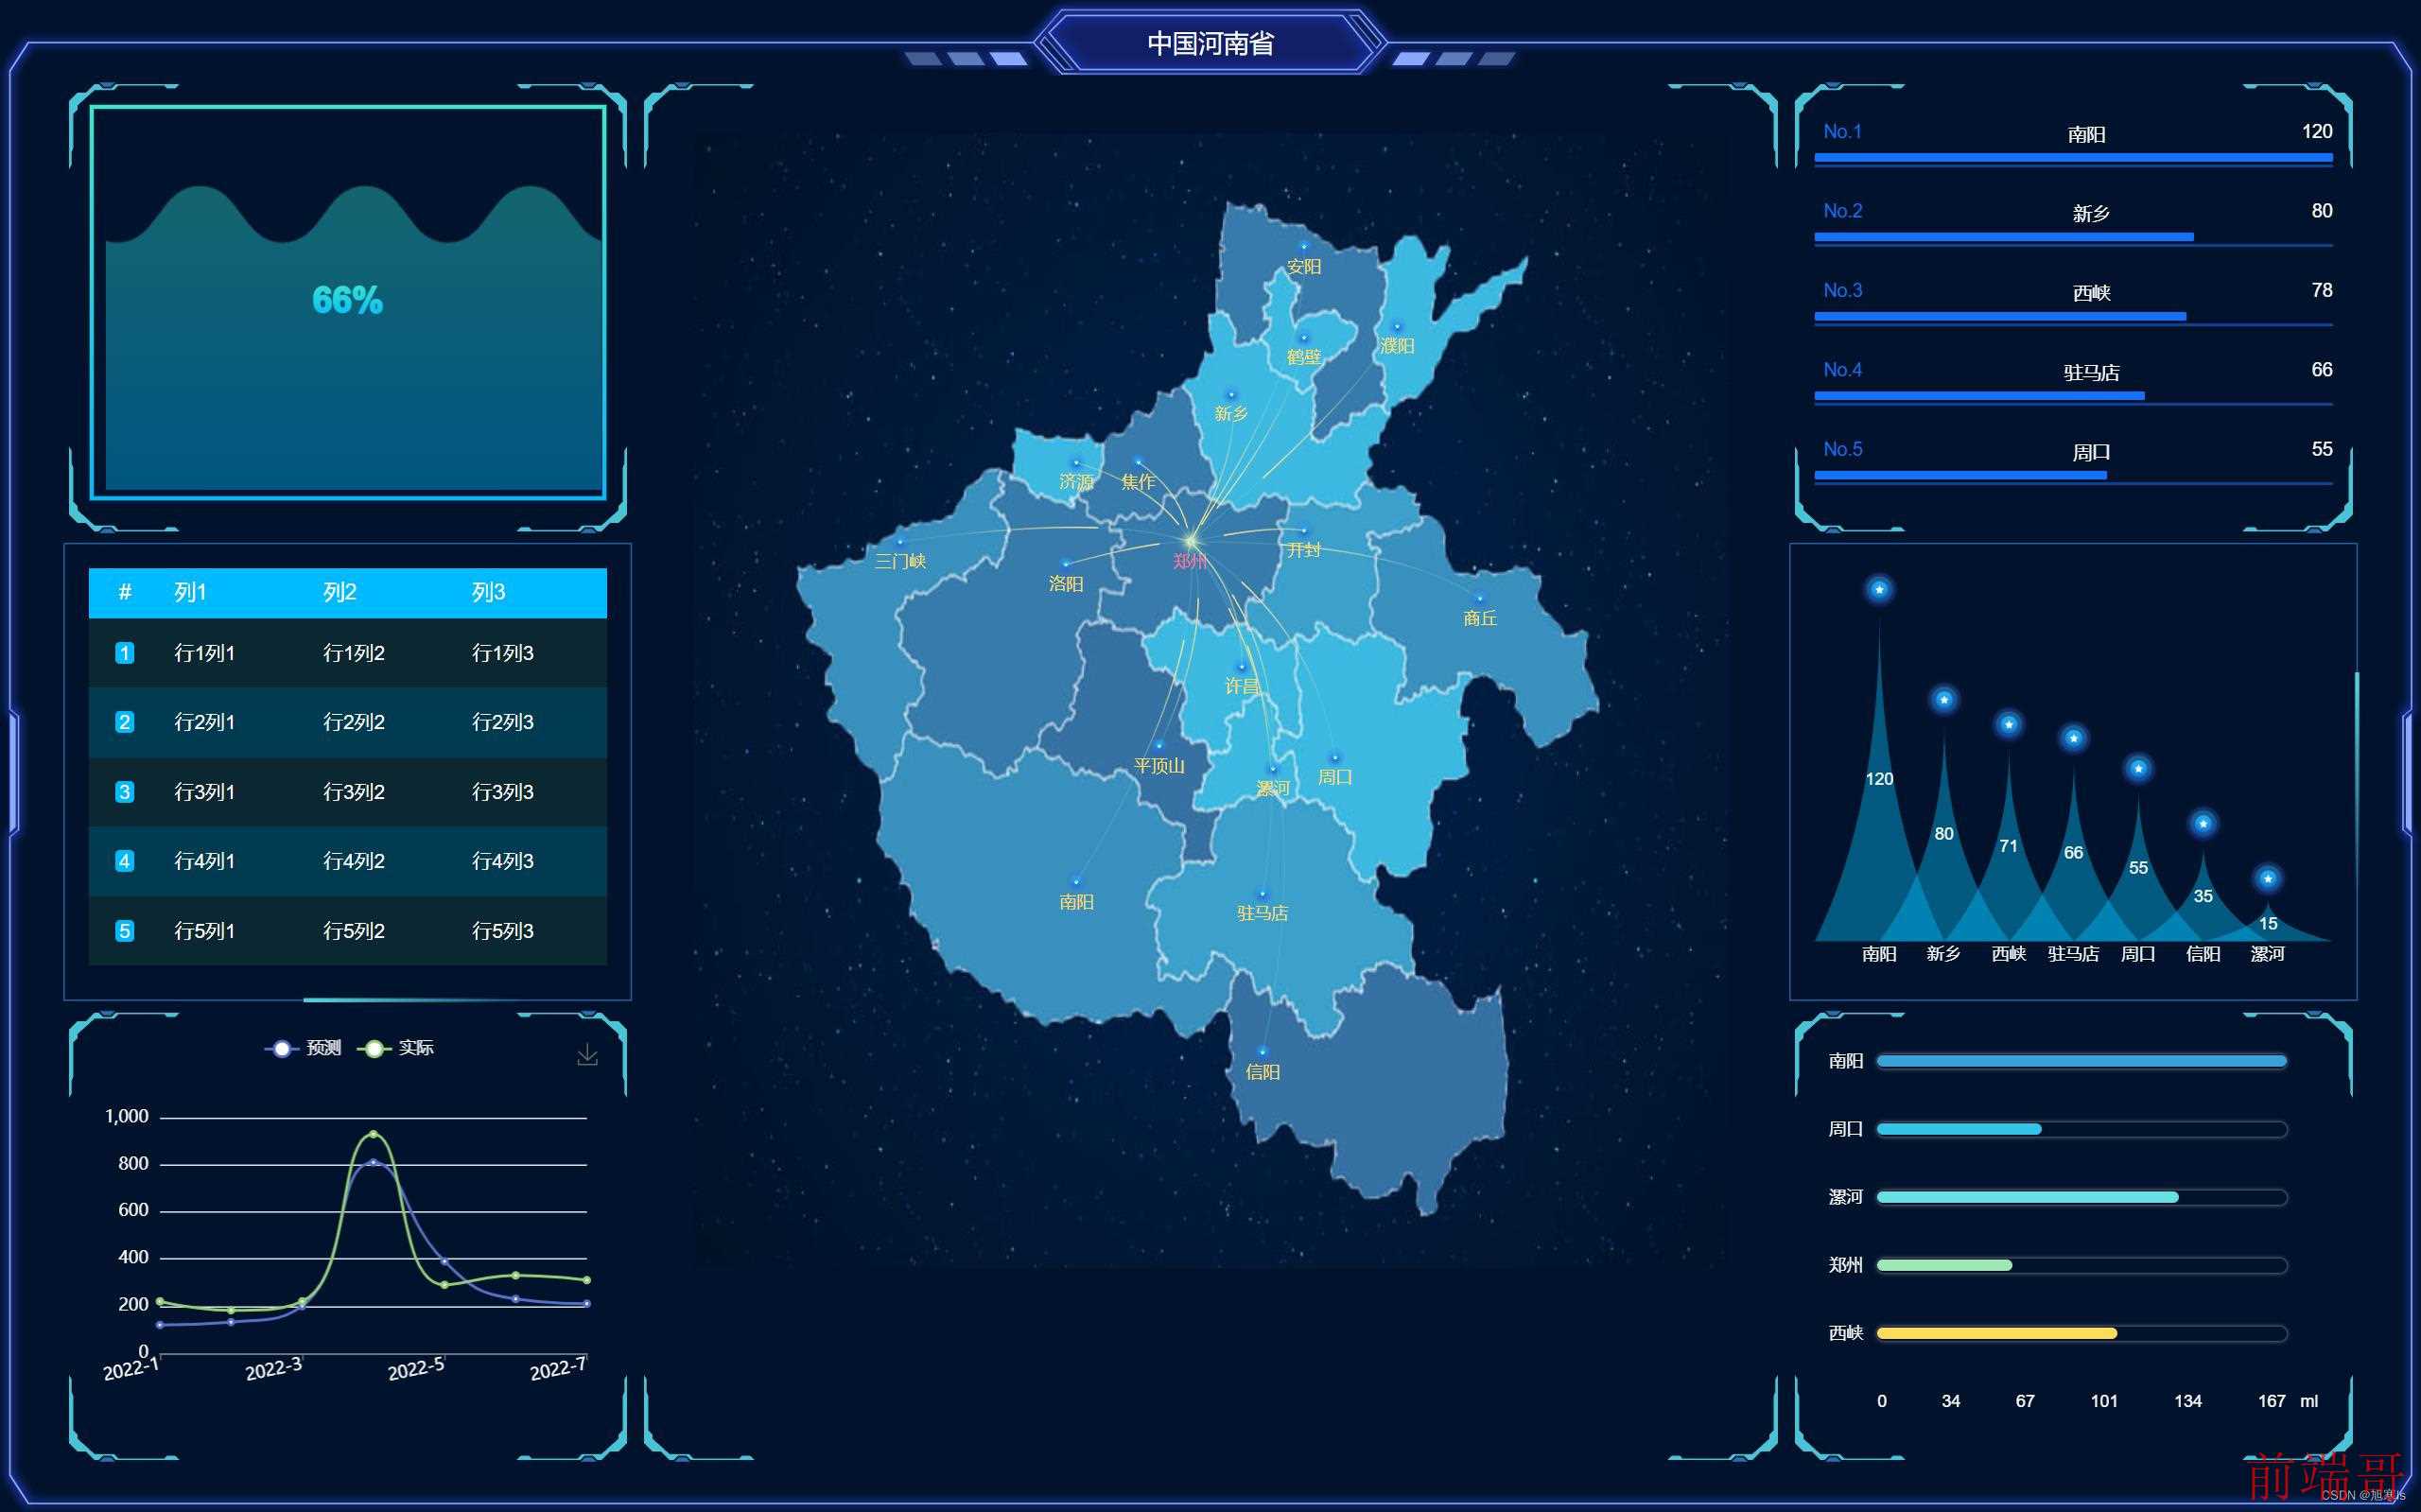
一.分别使用下面两句下载datav和echarts
npm install echarts --save
npm install @jiaminghi/data-view
二.在main.js文件中全局注册组件
import Vue from 'vue' import App from './App.vue' import router from './router' import store from './store' import dataV from '@jiaminghi/data-view' // 引入 echarts import * as echarts from 'echarts' Vue.prototype.$echarts = echarts Vue.use(dataV) Vue.config.productionTip = false new Vue({ router, store, render: h => h(App) }).$mount('#app')
三.准备工作,因为没有对接后端所以只能使用静态文件
1.使用datav中的一些组件需要准备的文件,我们创建一个config.js,里面的config1~8都是为各datav各组件准备的不同的数据格式,每个组件需要的数据格式和写法不太一样,具体可以参考官方文档里的示例datav官网地址
const config1={} const config2={ header: ['列1', '列2', '列3'], data: [ ['行1列1', '行1列2', '行1列3'], ['行2列1', '行2列2', '行2列3'], ['行3列1', '行3列2', '行3列3'], ['行4列1', '行4列2', '行4列3'], ['行5列1', '行5列2', '行5列3'], ['行6列1', '行6列2', '行6列3'], ['行7列1', '行7列2', '行7列3'], ['行8列1', '行8列2', '行8列3'], ['行9列1', '行9列2', '行9列3'], ['行10列1', '行10列2', '行10列3'] ], index: true, columnWidth: [50], align: ['center'], carousel: 'page' } const config3={ data: [ { name: '周口', value: 55 }, { name: '南阳', value: 120 }, { name: '西峡', value: 78 }, { name: '驻马店', value: 66 }, { name: '新乡', value: 80 }, { name: '信阳', value: 45 }, { name: '漯河', value: 29 } ] } const config4={} const config5={ points: [ { name: '郑州', coordinate: [0.48, 0.36], icon: { src: require('@/assets/mapCenterPoint.png'), width: 30, height: 30 }, text: { color: '#fb7293' } }, { name: '新乡', coordinate: [0.52, 0.23] }, { name: '焦作', coordinate: [0.43, 0.29] }, { name: '开封', coordinate: [0.59, 0.35] }, { name: '许昌', coordinate: [0.53, 0.47] }, { name: '平顶山', coordinate: [0.45, 0.54] }, { name: '洛阳', coordinate: [0.36, 0.38] }, { name: '周口', coordinate: [0.62, 0.55] }, { name: '漯河', coordinate: [0.56, 0.56] }, { name: '南阳', coordinate: [0.37, 0.66] }, { name: '信阳', coordinate: [0.55, 0.81] }, { name: '驻马店', coordinate: [0.55, 0.67] }, { name: '济源', coordinate: [0.37, 0.29] }, { name: '三门峡', coordinate: [0.20, 0.36] }, { name: '商丘', coordinate: [0.76, 0.41] }, { name: '鹤壁', coordinate: [0.59, 0.18] }, { name: '濮阳', coordinate: [0.68, 0.17] }, { name: '安阳', coordinate: [0.59, 0.10] } ], lines: [ { source: '新乡', target: '郑州' }, { source: '焦作', target: '郑州' }, { source: '开封', target: '郑州' }, { source: '许昌', target: '郑州' }, { source: '平顶山', target: '郑州' }, { source: '洛阳', target: '郑州' }, { source: '周口', target: '郑州' }, { source: '漯河', target: '郑州' }, { source: '南阳', target: '郑州' }, { source: '信阳', target: '郑州' }, { source: '驻马店', target: '郑州' }, { source: '济源', target: '郑州' }, { source: '三门峡', target: '郑州' }, { source: '商丘', target: '郑州' }, { source: '鹤壁', target: '郑州' }, { source: '濮阳', target: '郑州' }, { source: '安阳', target: '郑州' } ], icon: { show: true, src: require('@/assets/mapPoint.png') }, text: { show: true, }, bgImgSrc: require('@/assets/map.jpg') } const config6={ data: [ { name: '周口', value: 55 }, { name: '南阳', value: 120 }, { name: '西峡', value: 71 }, { name: '驻马店', value: 66 }, { name: '新乡', value: 80 }, { name: '信阳', value: 35 }, { name: '漯河', value: 15 } ], img: [ require('@/assets/mapPoint.png'), require('@/assets/mapPoint.png'), require('@/assets/mapPoint.png'), require('@/assets/mapPoint.png'), require('@/assets/mapPoint.png'), require('@/assets/mapPoint.png'), require('@/assets/mapPoint.png') ], showValue: true } const config7={ data: [ { name: '南阳', value: 167 }, { name: '周口', value: 67 }, { name: '漯河', value: 123 }, { name: '郑州', value: 55 }, { name: '西峡', value: 98 }, ], unit: 'ml' } const config8={ data: [66] } export { config1,config2,config3,config4,config5,config6,config7,config8}
2.datav内置的图表很多,但有的时候我们还是需要使用echarts来丰富图表,在使用datav的同时,我们想要使用echarts里的图表时需要将其写成组件,在components文件夹下创建echarts文件夹在里面创建line.vue文件,文件内容如下
<template> <div id="echartsID"> </div> </template> <script> export default { mounted() { this.echarts() }, methods: { echarts() { let myChart = this.$echarts.init(document.getElementById('echartsID')) myChart.setOption({ tooltip: { trigger: 'axis' }, legend: { data: ['预测', '实际',], bottom: 'auto', textStyle: { //图例文字的样式 color: 'white', }, }, grid: { left: '3%', right: '4%', bottom: '3%', containLabel: true }, toolbox: { feature: { saveAsImage: {} } }, xAxis: { type: 'category', boundaryGap: false, data: ['2022-1', '2022-2', '2022-3', '2022-4', '2022-5', '2022-6', '2022-7'], axisLabel: { rotate: 12, textStyle: { //图例文字的样式 color: 'white', }, }, }, yAxis: { type: 'value', axisLabel: { textStyle: { //图例文字的样式 color: 'white', }, }, }, series: [ { name: '预测', type: 'line', smooth: true, data: [120, 132, 200, 810, 390, 230, 210] }, { name: '实际', type: 'line', smooth: true, data: [220, 182, 220, 930, 290, 330, 310] } ] }); } }, } </script> <style scoped> #echartsID { width: 90%; height: 80%; } </style>
3.还有一些静态图片,在assets文件夹下放入图片文件“map.jpg”、“mapCenterPoint.png”、“mapPoint.png”,图片自取静态图片地址
四.准备工作做好了就可以开始写测试文件了,我是直接在HomeView.vue里写的
<template> <dv-full-screen-container class="container"> <div class="content"> <dv-border-box-11 title="中国河南省"> <div class="container laoda"> <div class="box left"> <dv-border-box-1 class="border-box"> <dv-water-level-pond :config="config8" class="charts" style="height:280px" /> </dv-border-box-1> <dv-border-box-8 class="border-box"> <dv-scroll-board :config="config2" class="charts" style="height:280px" /> </dv-border-box-8> <dv-border-box-1 class="border-box"> <!-- <dv-scroll-ranking-board :config="config3" class="charts" style="height:280px" /> --> <eline class="charts"></eline> </dv-border-box-1> </div> <div class="box center"> <dv-border-box-1 class="border-box"> <dv-flyline-chart-enhanced :config="config5" :dev="true" class="charts" style="height:800px"/> </dv-border-box-1> </div> <div class="box right"> <dv-border-box-1 class="border-box"> <dv-scroll-ranking-board :config="config3" class="charts" style="height:280px" /> </dv-border-box-1> <dv-border-box-8 :reverse="true" class="border-box"> <dv-conical-column-chart :config="config6" class="charts" style="height:280px;" /> </dv-border-box-8> <dv-border-box-1 class="border-box"> <dv-capsule-chart :config="config7" class="charts" style="height:280px" /> </dv-border-box-1> </div> </div> </dv-border-box-11> </div> </dv-full-screen-container> </template> <script> import eline from '../../src/components/echarts/line.vue' import { config1, config2, config3, config4, config5, config6, config7, config8 } from "./config.js" export default { components:{ eline }, name: "test1", data: function () { return { config1, config2, config3, config4, config5, config6, config7, config8 } }, } </script> <style scoped> .container { display: flex; flex-direction: row; background-color: #01132C; } .content { width: 100vw; height: 100vh; display: flex; flex-direction: row; } .left, .right { width: 25%; } .center{ width: 50%; } .charts { width: 90%; margin: 5%; } .laoda { margin: 5vh 2.5vw; width: 95vw; height: 92vh; display: flex; flex-direction: row; /* background-color: antiquewhite; */ } .box { display: flex; flex-direction: column; } </style>
完成后的样子

这样差不多就完成了,可以在这个基础上去测试别的组件,准备好组件所需数据就行了。

