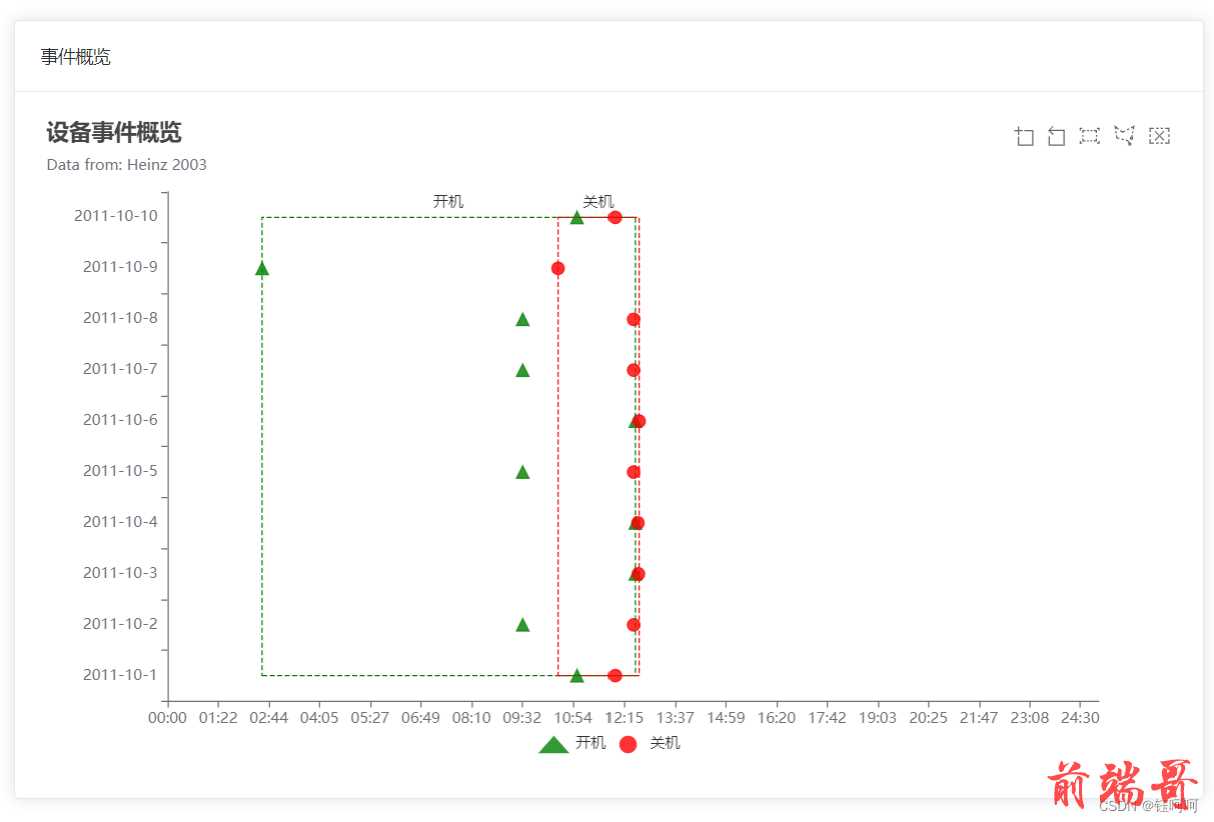
针对设备开关机、告警、停机等事件标记的散点图
- echartsX轴固定为时分(24小时),Y轴为具体日期
- 因为x轴只显示时分的话,只能代码生成固定[00:00~23:59]数组:
- 在组件页面初始化图表
- 图表展示
echartsX轴固定为时分(24小时),Y轴为具体日期
因为x轴只显示时分的话,只能代码生成固定[00:00~23:59]数组:
生成小时数组[00~23] 分钟数组[00~60] 代码.
/** * 生成时间格式基础字符串数组 * 生成24小时的数组 num=24 * 生成60分钟的数组 num=60 */ const timeArr = function (num: number) { let arr = []; for (let i = 0, j = num + 1; i < j; i++) { if (i < 10) { arr.push("0" + i); } else { arr.push("" + i); } } return arr; }; //["00","01"...."23"] //["00","01"..."60"]
将小时与分钟两数组合成 hh:mm 数组[00:00,00:01…,23:59] 代码. 其实也可以继续生成hh:mm:ss的数组,就是一层一层往下套
const time = (arr: string[], arr2: string[]) => { let len1 = arr.length;//小时数组长度 let len2 = arr2.length;//分钟数组长度 let end = []; let r = 0; while (r < len1) { for (let l = 0; l < len2; l++) { end.push(arr[r] + ":" + arr2[l]); } r++; continue; } return end; }; //1440个字符串数组
在组件页面初始化图表
const eventEchartsRef = ref<HTMLDivElement>(); //获取图表展示的dom 事件散点图 const eventEchart = echarts.init(eventEchartsRef.value as HTMLDivElement); //你可以手写也可以用第一个方法生成这两个数组 const hour = ['00', '01', '02', '03', '04', '05', '06', '07', '08', '09', '10', '11', '12', '13', '14', '15', '16', '17', '18', '19', '20', '21', '22', '23', '24'] const min = ['00', '01', '02', '03', '04', '05', '06', '07', '08', '09', '10', '11', '12', '13', '14', '15', '16', '17', '18', '19', '20', '21', '22', '23', '24', '25', '26', '27', '28', '29', '30', '31', '32', '33', '34', '35', '36', '37', '38', '39', '40', '41', '42', '43', '44', '45', '46', '47', '48', '49', '50', '51', '52', '53', '54', '55', '56', '57', '58', '59', '60'] let eventOption = { title: { text: "设备事件概览", }, grid: { left: "3%", right: "7%", bottom: "7%", containLabel: true, }, tooltip: { axisPointer: { show: true, type: "cross", lineStyle: { type: "dashed", width: 1, }, }, showDelay: 0, formatter: function (params: any) { if (params.value.length > 1) { return ( params.seriesName + " :<br/>" + params.value[0] + " " + params.value[1] + " " ); } else { return ( params.seriesName + " :<br/>" + params.name + " : " + params.value + " " ); } }, }, toolbox: { feature: { dataZoom: {}, brush: { type: ["rect", "polygon", "clear"], }, }, }, brush: {}, legend: { data: [ { name: "开机", // 强制设置图形为三角。 icon: "triangle", }, { name: "关机", // 强制设置图形为圆。 icon: "circle", }, ], left: "center", bottom: 10, }, xAxis: [ { type: 'category',//离散数据设置成category boundaryGap: false, axisLine: { onZero: false }, data: time(hour, min),//time方法会返回24小时时分的字符串数组 show: true, }, ], yAxis: [ { type: "category",//离散数据设置成category scale: true, splitLine: { show: false, }, }, ], series: [ { name: "开机", type: "scatter", emphasis: { focus: "series", }, // 开机数据 data: [ ['11:00', "2011-10-1"], ['09:33', "2011-10-2"], ['12:33', "2011-10-3"], ['12:33', "2011-10-4"], ['09:33', "2011-10-5"], ['12:33', "2011-10-6"], ['09:33', "2011-10-7"], ['09:33', "2011-10-8"], ['02:33', "2011-10-9"], ['11:00', "2011-10-10"], ], itemStyle: { borderColor: "green", color: "green", }, markArea: { silent: true, itemStyle: { color: "transparent", borderWidth: 1, borderType: "dashed", }, data: [ [ { name: "开机", xAxis: "min", yAxis: "min", }, { xAxis: "max", yAxis: "max", }, ], ], }, symbol: "triangle", }, //关机数据 { name: "关机", type: "scatter", emphasis: { focus: "series", }, // prettier-ignore data: [ ['12:00', "2011-10-1"], ['12:30', "2011-10-2"], ['12:38', "2011-10-3"], ['12:37', "2011-10-4"], ['12:30', "2011-10-5"], ['12:39', "2011-10-6"], ['12:30', "2011-10-7"], ['12:30', "2011-10-8"], ['10:30', "2011-10-9"], ['12:00', "2011-10-10"], ], symbol: "circle", itemStyle: { borderColor: "red", color: "red", }, markArea: { silent: true, itemStyle: { color: "transparent", borderWidth: 1, borderType: "dashed", }, data: [ [ { name: "关机", xAxis: "min", yAxis: "min", }, { xAxis: "max", yAxis: "max", }, ], ], }, }, ], };
图表展示


