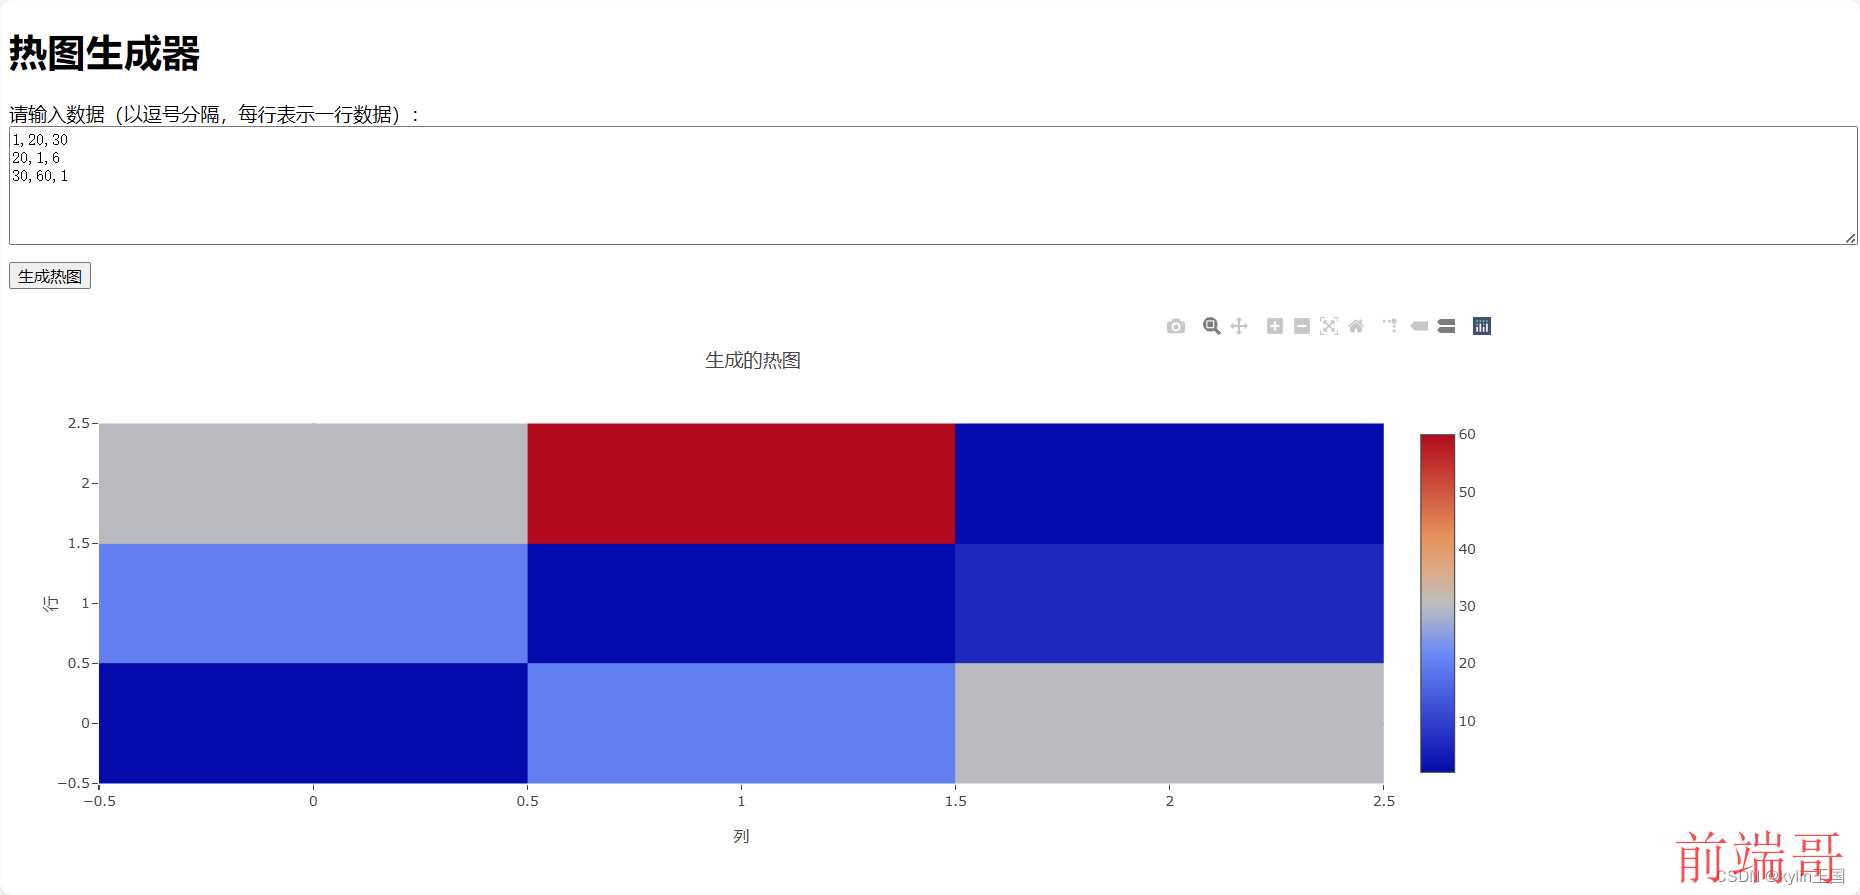
完整示例
| <!DOCTYPE html> |
| <html lang="zh-CN"> |
| <head> |
| <meta charset="UTF-8"> |
| <title>热图生成器</title> |
| <script src="https://cdn.plot.ly/plotly-latest.min.js"></script> |
| <style> |
| body { |
| font-family: Arial, sans-serif; |
| } |
| #inputContainer { |
| margin-bottom: 20px; |
| } |
| textarea { |
| width: 100%; |
| height: 100px; |
| } |
| button { |
| margin-top: 10px; |
| } |
| #heatmap { |
| width: 100%; |
| height: 500px; |
| } |
| </style> |
| </head> |
| <body> |
| <h1>热图生成器</h1> |
| <div id="inputContainer"> |
| <label for="dataInput">请输入数据(以逗号分隔,每行表示一行数据):</label> |
| <textarea id="dataInput">1,20,30\n20,1,60\n30,60,1</textarea> |
| <br> |
| <button onclick="generateHeatmap()">生成热图</button> |
| </div> |
| <div id="heatmap"></div> |
| |
| <script> |
| function generateHeatmap() { |
| |
| const inputData = document.getElementById('dataInput').value; |
| |
| |
| const rows = inputData.split('\n'); |
| const z = rows.map(row => row.split(',').map(Number)); |
| |
| |
| const data = [ |
| { |
| z: z, |
| type: 'heatmap' |
| } |
| ]; |
| |
| const layout = { |
| title: '生成的热图', |
| xaxis: { |
| title: '列' |
| }, |
| yaxis: { |
| title: '行' |
| } |
| }; |
| |
| |
| Plotly.newPlot('heatmap', data, layout); |
| } |
| </script> |
| </body> |
| </html> |
说明
- 引入Plotly.js库:在
<head>标签中,通过<script>标签引入Plotly.js库。 - 输入数据的文本区域:在
<div id="inputContainer">中添加一个<textarea>供用户输入数据。 - 生成热图的按钮:添加一个按钮,点击按钮时会调用
generateHeatmap函数。 - 生成热图的函数:
- 从
<textarea>中获取用户输入的数据。 - 将输入的数据按行拆分,并将每行数据按逗号拆分成数组。
- 使用这些数据生成热图。
- 使用Plotly.js的
Plotly.newPlot函数将热图绘制到<div id="heatmap">中。
使用方法
- 将上述代码保存为一个HTML文件(例如
heatmap_generator.html)。 - 在浏览器中打开该文件。
- 在文本区域中输入数据,每行代表一行数据,数据项之间用逗号分隔。例如:
- 点击“生成热图”按钮,热图将会显示在页面中。


