echarts柱图显示多级x轴及柱条分区显示
说明
官方demo:https://echarts.apache.org/examples/zh/editor.html?c=mix-line-bar
参考的文章:https://blog.csdn.net/chch87/article/details/123877652
效果截图: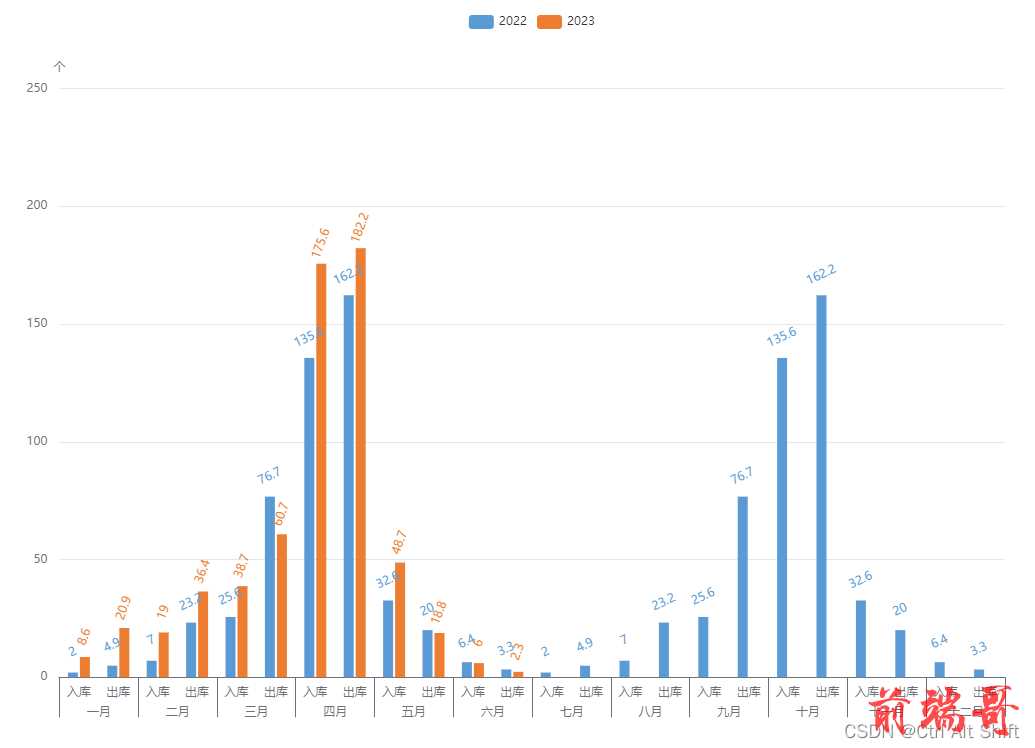
我其实是参考了网上博客(路径在上面)学到的这种设置x轴方法,整体思路就是先完成x轴、再完成数据处理、最后设置y轴柱图值,再此做个笔记。
实现零碎整理
- xAxisGroupData属性中的{offset|}:可用于设置axisLabel属性的距离,这里的一月至十二月设置了边线长度
| axisTick:{ |
| length:40, |
| interval:function(index,value){ |
| return groupSeparates[index]; |
| } |
| }, |
| axisLabel:{ |
| margin:30, |
| interval:0, |
| rich:{ |
| offset:{ |
| width:40 |
| } |
| } |
| } |
- x轴中的出库、入库部分依靠series里的两项data呈现,然后再给把小边线长度设置为0,这样看着就很像是一个模块中的
| axisTick:{ |
| length:0 |
| }, |
| axisLabel:{ |
| margin:10 |
| } |
- groupSeparates 中主要用于控制竖边线是否显示
全部代码(option)
| var years = ['2022', '2023']; |
| var xAxisData = ["入库", "出库", "入库", "出库", "入库", "出库","入库", "出库","入库", "出库","入库", "出库", "入库", "出库", "入库", "出库","入库", "出库","入库", "出库","入库", "出库","入库", "出库"]; |
| var xAxisGroupData = ["{offset|}一月", "", "{offset|}二月", "", "{offset|}三月","", "{offset|}四月", "", "{offset|}五月", "","{offset|}六月", "", "{offset|}七月", "", "{offset|}八月","", "{offset|}九月", "", "{offset|}十月", "", "{offset|}十一月", "", "{offset|}十二月", ""]; |
| var groupSeparates = [true, false, true, false, true, false, true, false, true, false,true, false, true, false, true, false, true, false, true, false, true, false, true, false]; |
| var option = { |
| tooltip: { |
| trigger: 'axis', |
| axisPointer: { |
| type: 'cross', |
| crossStyle: { |
| color: '#999' |
| } |
| } |
| }, |
| legend: { |
| data: years |
| }, |
| grid: { |
| top: '10%', |
| left: '10%', |
| right: '10%', |
| bottom: '15%', |
| }, |
| xAxis: [ |
| { |
| type: 'category', |
| data: xAxisData, |
| axisPointer: { |
| type: 'shadow' |
| }, |
| position:'bottom', |
| axisTick:{ |
| length:0 |
| }, |
| axisLabel:{ |
| margin:10 |
| } |
| },{ |
| position:'bottom', |
| data:xAxisGroupData, |
| axisTick:{ |
| length:40, |
| interval:function(index,value){ |
| return groupSeparates[index]; |
| } |
| }, |
| axisLabel:{ |
| margin:30, |
| interval:0, |
| rich:{ |
| offset:{ |
| width:40 |
| } |
| } |
| } |
| } |
| ], |
| yAxis: [ |
| { |
| type: 'value', |
| name: '个', |
| min: 0, |
| max: 250, |
| interval: 50, |
| axisLabel: { |
| formatter: '{value} ' |
| } |
| }, |
| ], |
| series: [ |
| { |
| name: years[0], |
| type: 'bar', |
| barWidth:10, |
| tooltip: { |
| valueFormatter: function (value) { |
| return value; |
| } |
| }, |
| data: [2.0, 4.9, 7.0, 23.2, 25.6, 76.7, 135.6, 162.2, 32.6, 20.0, 6.4, 3.3,2.0, 4.9, 7.0, 23.2, 25.6, 76.7, 135.6, 162.2, 32.6, 20.0, 6.4, 3.3], |
| itemStyle: { |
| normal: { |
| color:'#5b9bd5' |
| } |
| }, |
| label: { |
| show: true, |
| rotate: 25, |
| position: 'top', |
| distance: 20, |
| verticalAlign: 'middle', |
| textStyle: { |
| color: '#5b9bd5', |
| fontSize: 12 |
| } |
| } |
| }, |
| |
| { |
| name: years[1], |
| type: 'bar', |
| barWidth:10, |
| tooltip: { |
| valueFormatter: function (value) { |
| return value; |
| } |
| }, |
| data: [8.6, 20.9, 19.0, 36.4, 38.7, 60.7, 175.6, 182.2, 48.7, 18.8, 6.0, 2.3], |
| itemStyle: { |
| normal: { |
| color:'#ed7d31' |
| } |
| }, |
| label: { |
| show: true, |
| rotate: 70, |
| position: 'top', |
| distance: 20, |
| verticalAlign: 'middle', |
| textStyle: { |
| color: '#ed7d31', |
| fontSize: 12 |
| } |
| } |
| }, |
| ] |
| }; |


