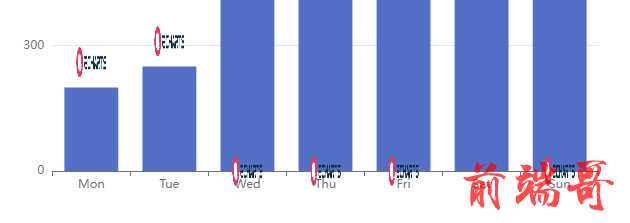
示图:

Echatrs结构代码:
option = { xAxis: { type: "category", data: ["Mon", "Tue", "Wed", "Thu", "Fri", "Sat", "Sun"], }, yAxis: {}, series: [ { data: [200, 250, 901, 934, 1290, 1330, 1320], type: "bar", markPoint: { data: [ { symbol: "image://https://echarts.apache.org/zh/images/logo.png?_v_=202 //图片地址 xAxis: 0, //图片所处x轴index(在第几个柱状图上) yAxis: 260, //y轴对应的值 serires[xAxis]+60让图片浮于柱子上方 }, { symbol: "image://https://echarts.apache.org/zh/images/logo.png?_v_=202 xAxis: 1, yAxis: 310, }, { symbol: "image://https://echarts.apache.org/zh/images/logo.png?_v_=202 xAxis: 2, yAxis: 0, }, { symbol: "image://https://echarts.apache.org/zh/images/logo.png?_v_=202 xAxis: 3, yAxis: 0, }, { symbol: "image://https://echarts.apache.org/zh/images/logo.png?_v_=202 xAxis: 4, yAxis: 0, }, { symbol: "image://https://echarts.apache.org/zh/images/logo.png?_v_=202 xAxis: 6, yAxis: 0, }, ], symbolSize: [30, 30], label: { show: false, }, }, }, ], };

